Better Collective: Building for stable growth
Research Update
2022-11-24
07:36
Redeye updates valuation and estimates on Better Collective following its Q3-results which was slightly lower than expected while the start to Q4 was strong and the full year guidance was reiterated. Still, we trim our estimates for 2023-24E due to the accelerated transition towards more revenue-share-based contracts. Our valuation range is lowered which is also impacted by higher risk-free interest rate assumptions.
HA
DF
Hjalmar Ahlberg
Douglas Forsling
Slightly soft Q3-result
Better Collective's Q3-result came in slightly soft with an EBITDA of EUR14.6m compared to our forecast of EUR17.4m. The main deviation was lower revenue in US which was impacted negatively in the short term due to the transaction from CPA contracts to revenue-share contracts. On the positive side, the company saw strong growth of 73% in revenue-share-based income while the intake of NDC's based on revenue-share contracts increased 101% YoY.
Solid start to Q4 and reiterated guidance
While the Q3-result was somewhat below our expectations, the start to Q4 was strong with EUR26m of revenue in October representing organic growth of 35%. With a continued positive seasonality for the rest of Q4 coupled with the FIFA World Cup the outlook for the rest of the year remains strong. The company also reiterates its target for the year (organic growth of 20-30% and EBITDA of around EUR85m) which also implies a strong end-of-year performance.
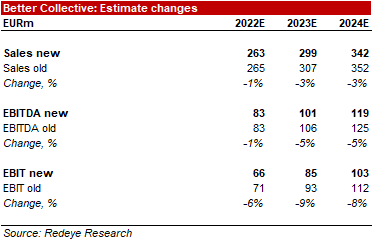
Limited changes for 2022E, trimmed 2023-24E estimates
All in all, we make limited changes to our 2022 estimates while trim our 2023-24E EBITDA with 5% as we take height for some additional impact from the transition from CPA to revenue-share based contract in the US. We have also increased our risk-free rate assumptions which lower our valuation range and our new base case stands at SEK270 (SEK300).
| EURm | 2020 | 2021 | 2022e | 2023e | 2024e |
| Revenues | 91.2 | 177.1 | 262.6 | 298.8 | 341.6 |
| Revenue Growth | 35.2% | 94.2% | 48.3% | 13.8% | 14.3% |
| EBITDA | 38.2 | 55.8 | 82.5 | 100.8 | 118.7 |
| EBITDA Margin | 41.8% | 31.5% | 31.4% | 33.7% | 34.8% |
| EBIT | 30.4 | 45.5 | 68.1 | 85.3 | 103.0 |
| Net Income | 21.9 | 17.3 | 48.5 | 62.5 | 77.2 |
| EV/EBITDA | 19.4 | 20.5 | 10.8 | 8.4 | 6.4 |
| EV/EBIT | 24.4 | 25.1 | 13.1 | 9.9 | 7.4 |
| P/E | 31.8 | 30.8 | 14.8 | 11.9 | 9.6 |
Slightly soft Q3-results
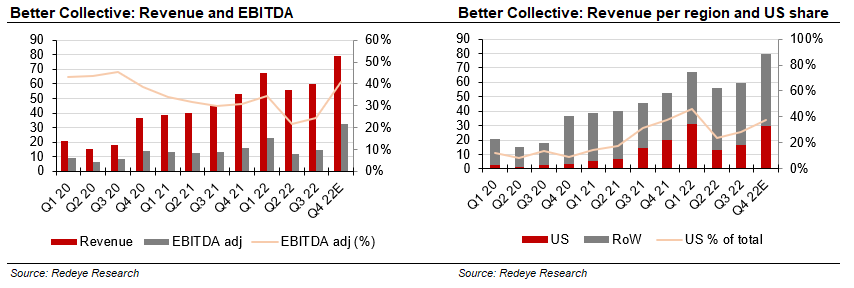
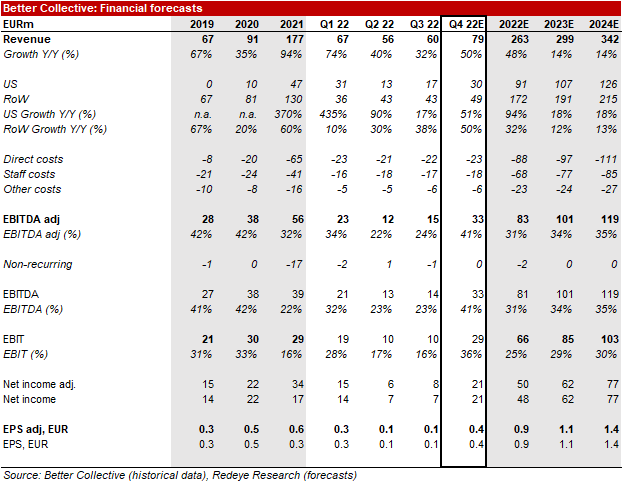
Better Collective reported Q3-revenue of EUR59.7m which was slightly lower than our forecast of EUR61.3m. On a regional basis, Europe and RoW came in stronger than expected while US was lower than expected. The company comments that the accelerated move from CPA-based contracts to more revenue-share based contracts in US impacted growth negatively and that growth in US would have been above 30% instead of 17% adjusted for this. EBITDA came in at EUR14.6m which was lower than our forecast of EUR17.4m and was mainly due to higher direct costs than expected while opex was close to our expectations.
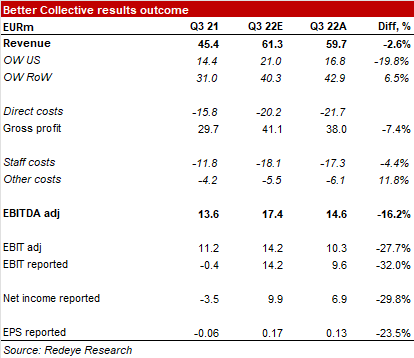
Solid outlook and reiterated guidance
Coming to the outlook for Q4 and 2022, the company reiterated its guidance for the full year (organic growth of 20-30% and EBITDA of around EUR85m) despite the accelerated move towards revenue-share based contracts in the US. The start of Q4 also looks solid with revenue of EUR26m in October which is consistent with our total revenue forecast of EUR79m for Q4 where November and December have potential to see strong revenue on the back of the FIFA Wold Cup. With limited cost growth expected in Q4, this also supports strong profitability and we expect an EBITDA-margin of 41% in Q4 2022. Fur the full year we forecast an EBITDA of EUR83m which is roughly in line with the company's guidance of approximately EUR85m.
Building for stable growth
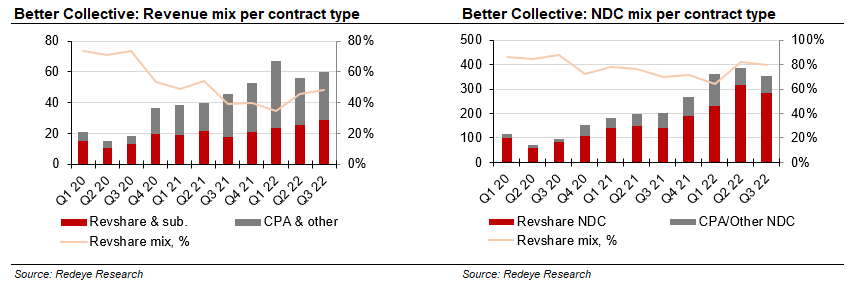
A key topic in Better Collective's Q3-report was the accelerated transition from CPA-based contracts towards revenue-share-based contracts in US. Historically, the majority of Better Collective's revenue has been derived from revenue-share-based contracts. The mix of CPA-based contracts increased in connection with the acquisition of Atemi in Q4 2020 which had a large share of CPA-based revenue, however, this has now largely been transitioned towards revenue-share-based contracts. With the acquisition of Action Network in Q2 2021 and the ensuing strong growth in US the CPA-based revenue mix saw another increase. From Q2 2022 Better Collective started transitioning its US operation towards an increased mix of revenue-share-based contracts and as illustrated in the charts below, both revenue and NDC intake have seen an increased mix of revenue-share based contracts in Q2 and Q3 2022. The trend is likely to continue in the coming quarters and while this impacts short-term growth negatively it builds for stable and recurring revenue which is positive for the longer term in our view.
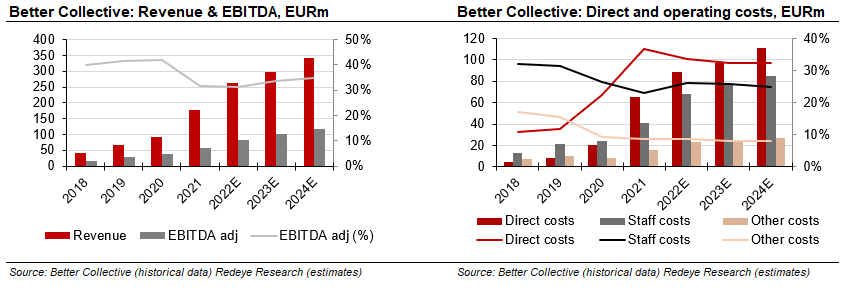
Operating leverage supports margin improvement in 2023-24E
While the impact from the transition towards revenue-share-based contracts impacts growth negatively we continue to expect Better Collective to improve profitability in 2023-24E. Operating costs came in slightly lower than expected in Q3 2022 and the company commented that it expects slower growth for the cost base going forward. This supports our view that opex should decline in relation to revenue in 2023-24E yielding an improved EBITDA-margin which we expect to increase from 31% in 2022E to 34% in 2023E and 35% in 2024E.
Slightly trimmed estimates
We have made limited changes to our 2022E estimates despite a slightly weak Q3-result as Q4 has started strong while the company reiterates its financial targets for the full year. Coming to 2023-24E we have trimmed our revenue estimates with around 3% to reflect the ongoing transition from CPA-based contracts to revenue-share-based contracts in US which impacted more negatively than expected in Q3 2022. On the back of the lower revenue assumptions, we also lower our EBITDA estimates with 5% for 2023-24E. We have also increased our assumptions for amortisations which came in higher than expected in Q3 relating to media partnerships resulting in EBIT estimates coming down around 9%.
Key financials 2019-24E
Valuation
On the back of the trimmed estimates coupled with an increased assumption for the risk-free rate (from 2.0% to 2.5%) we have lowered our valuation range where the new base case stands at SEK270 (SEK300) while the new bull cast stands at SEK400 (420) and the bear case at SEK150 (SEK160)
| Bear case SEK150 | Base case SEK270 | Bull case SEK400 |
| Our bear case assumes a higher number of competitors and higher investment needs to maintain and update products that impact profitability negatively. | Our base case scenario assumes solid growth in all markets with stable profitability and a stable competitive landscape. | Our bull case scenario assumes strong growth driven by the US and other new markets and an expanding margin on the back of scalability. |
| Average sales growth of about 8% between 2023-27 with EBITDA-margin of 30%. | Average sales growth of about 13% between 2023-27 with stable EBITDA-margin of c. 35%. | Average sales growth of about 16% between 2023-27 with gradually expanding EBIT-margin to c. 38%. |
| Terminal growth of 2% with terminal EBITDA-margin of 25%. | Terminal growth of 2% with terminal EBITDA-margin of 30%. | Terminal growth of 2% with terminal EBITDA-margin of 33%. |
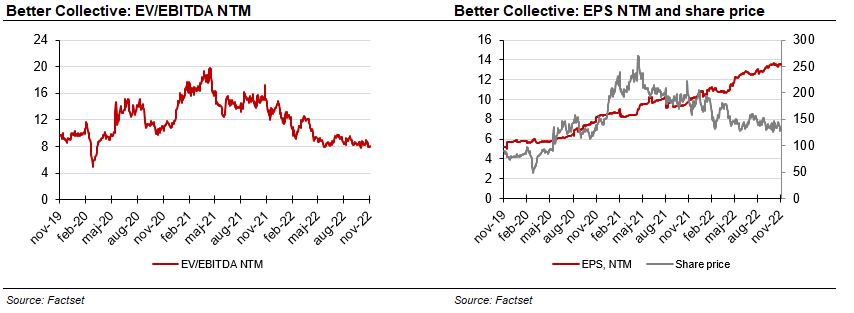
Valuation and estimate trend
Investment thesis
Case
Profitable growth supported by booming US sports betting market
Evidence
Solid track record by owner operated management team
Challenge
High growth in US will drive increased competition
Valuation
Base case DCF driven by US growth – implies valuation in higher end of historic EV/EBITDA range
Summary Redeye Ratings
The rating consists of three valuation keys, each consituting an overall assesment of several factors that are rated on a scale of 0 to 1 points. The maximum score for a valuation key is 5 points.
People: 4
We regard management as capable, with notable industry experience. Impressively, Jesper Søgaard and Christian Kirk Rasmussen have taken Better Collective from a single site to the world’s leading sports betting affiliate. However, board members average a relatively short history with the company. The founders, who are also part of top management, hold the majority of the shares. We consider this positive as this creates long-term alignment with shareholders. Chairman of the board Jens Bager holds over 2%, while several other board members and the CFO also have significant shareholdings. This strengthens the ownership structure further. Moreover, Better Collective has several institutional investors among its largest owners, which we view as a further stamp of quality.
Business: 3
The bulk of sales are generated from regulated markets, which mitigates regulatory risk. The US market and several large South American markets offers a large potential for Better Collective, as they are being regulated. The operations are also highly scalable, and the gross margin is above 60%, including Paid Media. Better Collective’s community sites create network effects and barriers against new competitors. Moreover, much of the sites’ traffic is direct, leading to low dependence on Google and expensive paid media compared to peers. On the negative side, Better Collective is still exposed to regulatory risks and potential margin pressure. Furthermore, despite its rapid growth pace Better Collective still has strong EBIT margin of above 30% with strong cash flow.
Financials: 3
Better Collective is a very active and successful industry consolidator with several acquisitions carried through in the last years. While this can increase leverage in the short term the company’s strong cash generation means this quickly improves and opens for further growth by acquisitions.
Income Statement
| Income statement | |||||
| EURm | 2020 | 2021 | 2022e | 2023e | 2024e |
| Revenues | 91.2 | 177.1 | 262.6 | 298.8 | 341.6 |
| Cost of Revenue | 20.5 | 64.9 | 88.5 | 97.0 | 110.8 |
| Operating Expenses | 32.6 | 56.4 | 91.6 | 101.1 | 112.1 |
| EBITDA | 38.2 | 55.8 | 82.5 | 100.8 | 118.7 |
| Depreciation | 1.6 | 1.8 | 2.2 | 1.5 | 1.7 |
| Amortizations | 6.2 | 8.5 | 12.2 | 14.0 | 14.0 |
| EBIT | 30.4 | 45.5 | 68.1 | 85.3 | 103.0 |
| Shares in Associates | 0.00 | 0.00 | 0.00 | 0.00 | 0.00 |
| Interest Expenses | 3.8 | 5.9 | 7.1 | 2.0 | 0.00 |
| Net Financial Items | -1.8 | -2.5 | -3.0 | -2.0 | 0.00 |
| EBT | 28.7 | 26.2 | 63.5 | 83.3 | 103.0 |
| Income Tax Expenses | 6.8 | 8.9 | 15.0 | 20.8 | 25.7 |
| Net Income | 21.9 | 17.3 | 48.5 | 62.5 | 77.2 |
Balance Sheet
| Balance sheet | |||||
| Assets | |||||
| Non-current assets | |||||
| EURm | 2020 | 2021 | 2022e | 2023e | 2024e |
| Property, Plant and Equipment (Net) | 5.4 | 1.7 | 1.1 | 1.1 | 1.1 |
| Goodwill | 99.3 | 178.2 | 178.2 | 178.2 | 178.2 |
| Intangible Assets | 159.7 | 341.7 | 439.4 | 431.3 | 424.2 |
| Right-of-Use Assets | 0.00 | 2.7 | 2.7 | 2.7 | 2.7 |
| Other Non-Current Assets | 2.1 | 10.2 | 10.2 | 10.2 | 10.2 |
| Total Non-Current Assets | 266.5 | 534.5 | 631.6 | 623.6 | 616.4 |
| Current assets | |||||
| EURm | 2020 | 2021 | 2022e | 2023e | 2024e |
| Inventories | 0.00 | 0.00 | 0.00 | 0.00 | 0.00 |
| Accounts Receivable | 18.2 | 30.1 | 44.6 | 59.8 | 68.3 |
| Other Current Assets | 9.2 | 4.2 | 13.1 | 29.9 | 34.2 |
| Cash Equivalents | 21.1 | 28.6 | 46.4 | 94.1 | 176.4 |
| Total Current Assets | 48.6 | 62.9 | 104.2 | 183.7 | 278.8 |
| Total Assets | 315.1 | 597.4 | 735.8 | 807.3 | 895.2 |
| Equity and Liabilities | |||||
| Equity | |||||
| EURm | 2020 | 2021 | 2022e | 2023e | 2024e |
| Non Controlling Interest | 0.00 | 0.00 | 0.00 | 0.00 | 0.00 |
| Shareholder's Equity | 162.5 | 344.8 | 393.3 | 455.8 | 533.0 |
| Non-current liabilities | |||||
| EURm | 2020 | 2021 | 2022e | 2023e | 2024e |
| Long Term Debt | 69.3 | 121.1 | 196.1 | 196.1 | 196.1 |
| Long Term Lease Liabilities | 2.1 | 1.5 | 1.5 | 1.5 | 1.5 |
| Other Non-Current Lease Liabilities | 54.8 | 74.5 | 74.5 | 74.5 | 74.5 |
| Total Non-Current Liabilities | 126.2 | 197.1 | 272.1 | 272.1 | 272.1 |
| Current liabilities | |||||
| EURm | 2020 | 2021 | 2022e | 2023e | 2024e |
| Short Term Debt | 0.02 | 0.00 | 0.00 | 0.00 | 0.00 |
| Short Term Lease Liabilities | 1.3 | 1.3 | 1.3 | 1.3 | 1.3 |
| Accounts Payable | 10.2 | 18.4 | 26.3 | 29.9 | 34.2 |
| Other Current Liabilities | 14.8 | 35.7 | 42.8 | 48.2 | 54.6 |
| Total Current Liabilities | 26.3 | 55.5 | 70.4 | 79.5 | 90.1 |
| Total Liabilities and Equity | 315.1 | 597.4 | 735.8 | 807.3 | 895.2 |
Cash Flow
| Cash flow | |||||
| EURm | 2020 | 2021 | 2022e | 2023e | 2024e |
| Operating Cash Flow | 26.7 | 31.6 | 54.3 | 55.1 | 90.8 |
| Investing Cash Flow | -68.1 | -219.2 | -111.5 | -7.5 | -8.5 |
| Financing Cash Flow | 46.8 | 188.8 | 75.0 | 0.00 | 0.00 |
Disclosures and disclaimers