Fortnox: Positive Signs in Pengar
Research Update
2022-10-27
06:45
Redeye retains its positive view of Fortnox despite somewhat lowering its short-term forecasts and reducing the Base Case. The important net customer intake continues to perform, and the positive signs in Pengar are promising, supporting the long-term case.
FN
Fredrik Nilsson
Contents
ARPC Somewhat Below Forecast
While net customer intake matched our forecast at 10,000 (10,000), sales came in 5% short of our forecast due to slightly lower sales and ARPC in every segment. EBIT was 9% under our estimate following lower sales and a somewhat higher net recruitment and cost per employee. Note that due to some reclassification of revenues following the new segment reporting, do not emphasize the deviation on the segment level.
Improving Growth Rates in Pengar
During Q2 and Q3 2022, the ARPC from Pengar Transactions and Lending increased by over 40% y/y. While it is from rather low levels, it is a sharp increase in growth rate compared to earlier quarters. Thus, it seems like the investments in Pengar are finally paying off.
New Base Case SEK55 (61)
We lower our Base Case to SEK55 from 61, due to lowered short-term forecasts and an increased risk-free rate from 2% to 2.5%. As we keep our long-term forecasts largely unchanged, the impact of the short-term reduction and raised WACC is rather limited. While we were too optimistic on some lines, the important net customer intake continues to perform, and the positive signs in Pengar are promising. Thus, we keep our positive view, although the upside to our Base Case is smaller than seen for a while.
| SEKm | 2020 | 2021 | 2022e | 2023e | 2024e |
| Revenues | N/A | N/A | N/A | N/A | N/A |
| Revenue Growth | 30.4% | 34.3% | 36.2% | 29.0% | 26.2% |
| EBITDA | 332.0 | 399.6 | 582.1 | 801.7 | 1,059.2 |
| EBIT | 265.4 | 314.7 | 455.6 | 659.5 | 898.6 |
| EBIT Margin | 38.3% | 33.8% | 35.9% | 40.3% | 43.5% |
| Net Income | 205.4 | 241.0 | 350.4 | 520.4 | 710.3 |
| EV/Revenue | 39.8 | 37.9 | 23.9 | 18.3 | 14.3 |
| EV/EBIT | 104 | 112 | 66.6 | 45.5 | 32.8 |
Case
Swedish SME’s leading software provider
Evidence
Impressive track record of cost-efficient growth
Challenge
High profitability attracts competition
Challenge
How many modules and services do the average SME need?
Valuation
Fair Value SEK 55
Sales and EBIT Somewhat Below our Expectations

Net customer intake was 10,000 (10,000), matching our forecast. We believe the number indicates Fortnox continues to gain market share in the Swedish market. Note that Q3 is always the weakest quarter regarding net customer intake.
Sales was SEK332m (237), corresponding to a y/y growth of 40.3%, which of 5.7% %-points from M&A. The number was 2.6% below our forecast, mainly due to lower sales from Core Subscriptions (Företagande, Byrån, Entreprenören) relative to our estimates. We believe the strong ARR seen in Q2 fueled by price increases should have had an even greater impact. We will discuss this further later in the Update. Pengar Transactions/Lending, basically Fortnox Finance, came in slightly lower than we expected. However, the growth rate increased relative to last year’s Q3 and considering the new segment reporting, the growth rates were stronger than expected (we had only access to the data from the earlier reporting before this report and some revenue has been reclassifed to other segments).
EBIT was 9% below our forecast due to the lower-than-expected sales as well as higher Other external costs and Personnel expenses relative to our forecasts. While the net recruitment was somewhat higher than we anticipated, the main reason behind the deviation was higher costs per employee.
As often highlighted by the management, Fortnox is investing in several products and services that are not yet revenue-generating. Notably, the three Core segments, which are more mature than the rest of Fortnox, have an average operational margin of impressive ~70%.
Reclassification of Revenue Between Segments Broke Our Prediction
Although the 5% difference to our estimate regarding Core Subscriptions (Företagande, Byrån, Entreprenören) might not seem that significant, based on the historical correlation between ARR and Core Subscriptions, we are surprised by the deviation. The graph below shows that the ARPC for Core Subscriptions is rarely below last quarter’s average ARR per customer (ARPC ARR).

The new segment reporting holds the answer. While our conversion from what we called Subscription-based (SoFA) of the old segment reporting does not match the Core Subscriptions of the new segment reporting perfectly, the match is actually 97.5% for all three quarters, where we have access to both data. The reason is that the Integrera (Integrate) module has been moved from Core Subscriptions to Marknadsplatsen. While we should have adjusted our forecasts accordingly, as the move was known, we lacked data for Q3 2021 before this report. When adjusting for the revenue shift from Core Subscriptions to Marknadsplatsen, Core Subscriptions aligned with our forecasts in the quarter, while Marknadsplatsen came in somewhat short.
Price Increases are Likely the Main ARPC Driver – Will Pengar Be Next?
About 2/3 of the y/y ARPC increase is driven by Core Subscriptions (Företagande, Byrån, Entreprenören), which we believe to a large extent, is driven by the price increases announced in H1 2022. As that effect fades in H2 2023, Fortnox will need other sources of ARPC growth to maintain its sales growth rate. While we expect sales growth to decline to ~25% in H2 2023, that requires increased absolute growth from Pengar (Fortnox Finance) and continuing strong development for Core Transactions.
During Q2 and Q3 2022, the ARPC from Pengar Transactions and Lending increased by over 40% y/y. While it is from rather low levels, it is a sharp increase in growth rate compared to earlier quarters. Thus, it seems like the investments in Pengar are finally paying off. However, the numbers in the new segment reporting do not match what we believe were the corresponding numbers in the earlier segment reporting, as there has been a reclassification. Thus, we do not make any major conclusions until we receive additional quarters with the new segment reporting.
Financial Forecasts
We lower our sales forecast by about 2.5% per year for 2022e and 2023e. As the 2023e sales depend on 2022e sales, the actual decrease is 5% for 2023e. Besides the slightly lower sales than expected in most segments, the ARR indicates a rather low q/q growth in Q4, and we expect macroeconomic conditions to reduce the growth in transaction revenue slightly in 2023e.
As Fortnox is a scalable business, reduced sales forecasts significantly impact EBIT. Also, we raise our OPEX forecasts somewhat due to higher net recruitment and cost per employee, resulting in a ~10% cut in EBIT for 2022e an 2023e.


Note that we lack actuals for Q4 2021 regarding segment sales. Thus, the estimated growth rates might not correspond to the actual growth rates, given our estimated sales number.
Valuation
We lower our Base Case to SEK55 from 61, due to lowered short-term forecasts and an increased risk-free rate from 2% to 2.5%.
Peer Valuation

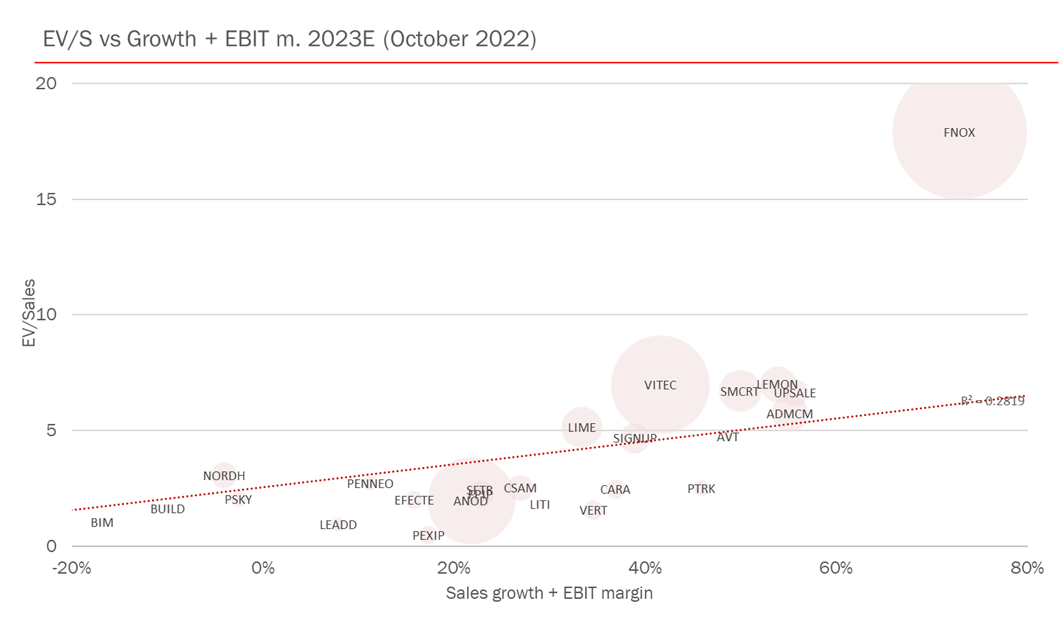
Trading at ~18x sales 2023E, Fortnox is the highest valued business in our comparison. However, we believe that is for good reasons:
- We expect Fortnox to have the highest combination of sales growth and EBIT margin (~70 in 2023).
- Fortnox dominates a market which we believe will grow rapidly for many years.
- Fortnox has unmatched access to Swedish SME data.
- With >400 integrations, Fortnox is the leading ecosystem for Swedish SMEs.
We believe the three last factors give Fortnox a competitive advantage that most other Nordic SaaS businesses lack, making Fortnox able to grow with rising margins for many years. That should result in a premium relative to peers on 2023 sales and earnings.
Source: FactSet, Redeye
On the other hand, the premium toward the Nordic SaaS median is higher than we have ever seen before. While Fortnox’s pricing power, which the recent price increases have highlighted, motivates a premium, we believe investors should be aware that Fortnox’s valuation multiples have remained largely unchanged, unlike most SaaS businesses.
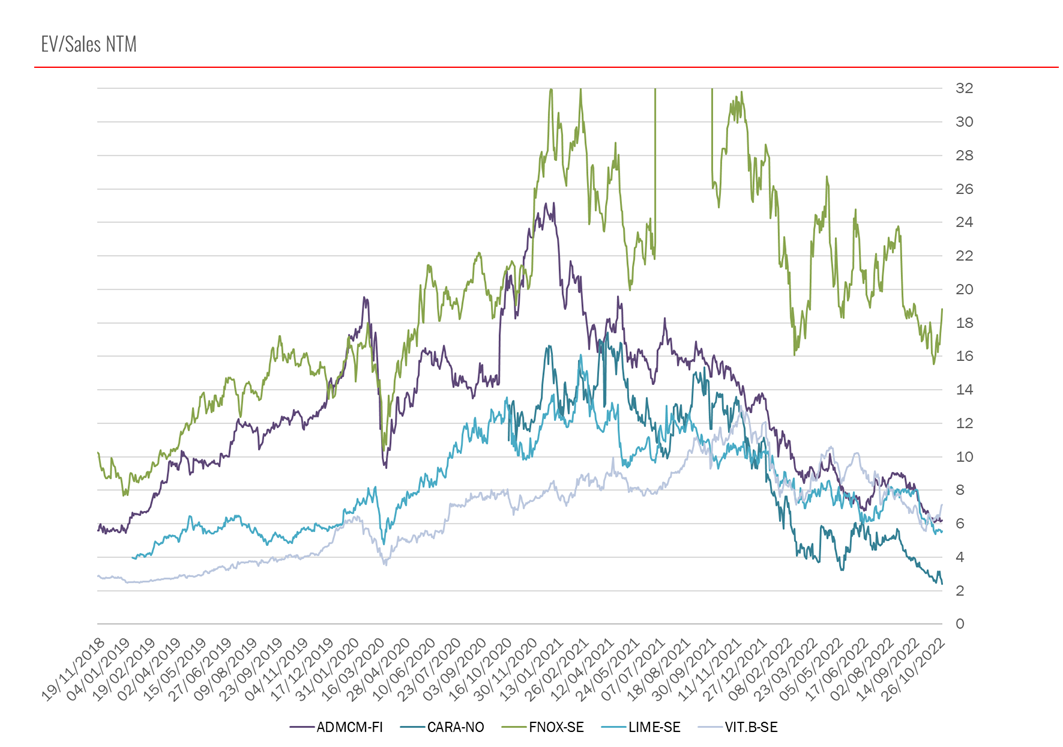
Source: FactSet
Unfortiently, there is some error in the data regarding Fortnox in late 2021. However, we believe the figure is nevertheless useful.
| Income statement | |||||
| SEKm | 2020 | 2021 | 2022e | 2023e | 2024e |
| Revenues | N/A | N/A | N/A | N/A | N/A |
| Cost of Revenue | 96.3 | 83.4 | 91.1 | 122.8 | 155.0 |
| Operating Expenses | 265.4 | 449.0 | 596.1 | 713.2 | 852.8 |
| EBITDA | 332.0 | 399.6 | 582.1 | 801.7 | 1,059.2 |
| Depreciation | 5.1 | 9.2 | 13.2 | 14.0 | 17.7 |
| Amortizations | 36.5 | 50.6 | 75.9 | 89.0 | 103.7 |
| EBIT | 265.4 | 314.7 | 455.6 | 659.5 | 898.6 |
| Shares in Associates | 0.00 | 0.00 | 0.00 | 0.00 | 0.00 |
| Interest Expenses | -3.3 | -5.2 | -6.5 | -4.0 | -4.0 |
| Net Financial Items | 3.3 | 5.2 | 6.5 | 4.0 | 4.0 |
| EBT | 262.2 | 309.5 | 449.1 | 655.5 | 894.6 |
| Income Tax Expenses | -56.8 | -67.7 | -98.7 | -135.0 | -184.3 |
| Net Income | 205.4 | 241.0 | 350.4 | 520.4 | 710.3 |
Disclosures and disclaimers
Contents