Smart Eye: Comment on Terms for Rights Issue
Research Update
2023-01-24
08:10
Redeye comments on the subscription price for the ongoing rights issue - which was set below Redeye's expectations. Redeye lowers its Base Case and Bull Case by c10%. This text has been updated.
JVK
Jesper Von Koch
Subscription price below estimates - higher dilution
Last night, Smart Eye announced the terms of its ongoing rights issue.
Key take aways from the terms:
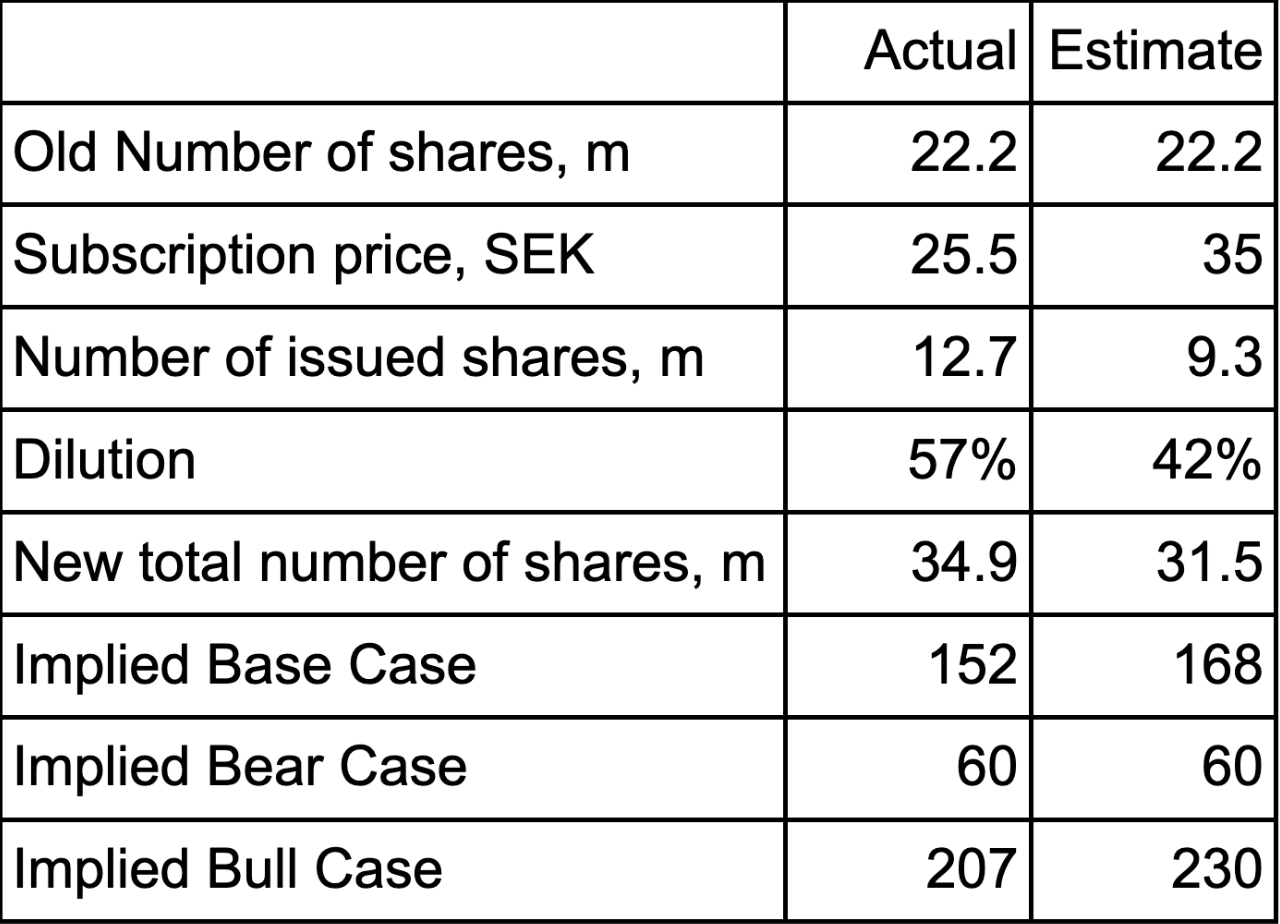
- Subscription price set at SEK25.5 per share - well below our estimated SEK35, implying a bigger dilution than expected
- Gross proceeds is SEK324m, and net proceeds SEK289m, implying transaction costs of SEK35m
- Existing owners will receive 4 BTA for every 7 shares held on 31 January - each BTA grants preferential right to subscribe for one new share
- Trading in BTA will start on 2 February to and including 23 February
The key takeaway is the low subscription price, which was set c42% under yesterday's trading price. We argue that this discount was bigger than what would likely have been needed. The subscription price implies a 57% dilution of existing shareholders. We had previously estimated a subscription price of SEK35 and a dilution of 42%. However, the subscription price was in line with our Bear Case estimates.
As such, the higher-than-expected dilution makes us lower our Base Case from SEK168 to SEK152, and our Bull Case from SEK230 to SEK207. Our Bear Case is reiterated at SEK60 per share.
Case
In pole position within eye tracking for mandated driver monitoring
Evidence
The revenue acceleration is highly predictable
Supportive Analysis
Challenge
Head-to-head competition with main competitor
Valuation
Rapid, predictable growth to a low price
People: 4
Smart Eye is governed by an owner operator as the co-founder is the CEO, which is positive in many ways. Compensation is moderate and just. We especially like the tendency to include all employees in the stock option programs, which indicates a healthy HR policy that could explain the relatively low employee turnover. The solid growth trend during the years prior to the listing implies that so far investments have been savvy and execution essentially flawless. Overall the Management score is hampered by Smart Eye's short period on the stock market where e.g. there is not much history of Smart Eye's communication to the shareholders as a listed company. As mentioned Smart Eye is governed by owner operators where the founding family (Martin & Mats Krantz) together owns ~15% of the company. Overall, insiders in the Board as well as Management own a lot of shares and keep on adding to their positions. The founding family really has put their money where their mouths are. Thus, the ownership structure is in short very appealing. Our only concern is if there are enough financial muscles to back up the Company should there be need for future supplementary investments.
Business: 4
Smart Eye is the market leader in a viable niche within driver monitoring whose Automotive business unit is expected to grow at a CAGR of more than 100 percent until 2025, especially driven by autonomous vehicles and traffic safety. Following an 18 year focus in automotive Smart Eye has established important relations with all potential tier 1 customers. Smart Eye's automotive focus and the recurring software licenses together imply sticky and predictable revenue for the foreseeable future. In addition, high barriers to entry mean limited competition. All in all, it is a great business.
Financials: 2
Our profitability rating is fully retrospective and requires consistent, positive earnings. As Smart Eye is not profitable at the moment it therefore cannot have a higher score for now. However, Smart Eye has a scalable business model with low costs, meaning the stage is set for a gradually increased rating ahead should the Company keep up its growth trend. The cash position and liquidity measurements of Smart Eye are currently tight and the company will need additional cash before the end of 2022. Smart Eye also loses some points as the company at the moment has negative earnings and cash flow. In addition, there is a risk in the cyclicality of the automotive industry as the customers must be able to afford to fully embrace the new driver monitoring technology. However, the amount of customers and their respective share of total sales is reasonably diversified.
| Income statement | |||||
| SEKm | 2020 | 2021 | 2022e | 2023e | 2024e |
| Revenues | 61.3 | 109.3 | 219.8 | 372.6 | 623.2 |
| Cost of Revenue | -40.2 | 12.4 | 30.0 | 55.9 | 94.3 |
| Operating Expenses | 153.2 | 185.9 | 375.0 | 378.0 | 400.0 |
| EBITDA | -51.7 | -89.0 | -185.1 | -61.3 | 128.9 |
| Depreciation | 23.7 | 42.4 | 0.00 | 0.00 | 0.00 |
| Amortizations | 0.00 | 0.00 | 149.0 | 161.2 | 169.2 |
| EBIT | -75.4 | -131.4 | -334.2 | -222.5 | -40.3 |
| Shares in Associates | 0.00 | 0.00 | 0.00 | 0.00 | 0.00 |
| Interest Expenses | 0.40 | -0.19 | 0.77 | 0.00 | 0.00 |
| Net Financial Items | -0.20 | 0.20 | -0.77 | 0.00 | 0.00 |
| EBT | -75.6 | -131.2 | -335.0 | -222.5 | -40.3 |
| Income Tax Expenses | 0.00 | 0.00 | -2.6 | 0.00 | 0.00 |
| Net Income | -75.6 | -131.2 | -332.4 | -222.5 | -40.3 |
| Balance sheet |
| Assets |
| Non-current assets |
| Current assets |
| Equity and Liabilities |
| Equity |
| Non-current liabilities |
| Current liabilities |
| Cash flow |
Disclosures and disclaimers