Evolution: Solid year-end
Research Update
2023-02-03
07:32
Redeye updates its view on Evolution post Q4-results which came in just above our expectations and we have slightly raised our estimates and valuation range.
HA
AH
Hjalmar Ahlberg
Anton Hoof
Q4-results slightly above expectations
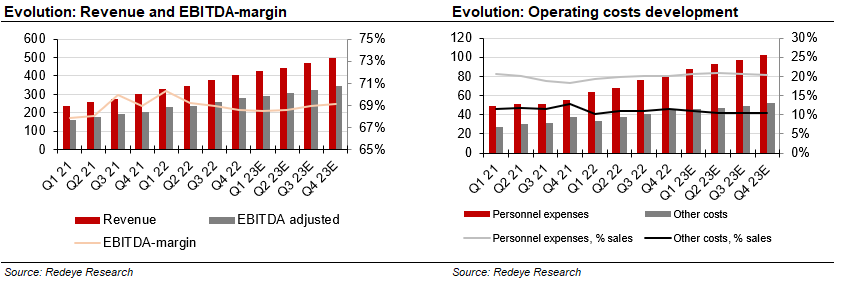
Evolution reported solid Q4-results with revenue and EBITDA coming in just above our expectations. Growth was overall good in all markets although slightly lower than expected in Asia while we were pleased to see better-than-expected growth in Europe and North America.
Strong margin guidance, albeit with wider range
Looking into 2023, the company guides for a EBITDA-margin in the range of 68-71% which is strong in our view considering the general global inflationary pressure. We forecasted a margin of around 68% for 2023E ahead of the report which we have now raised slightly to around 69%.
Slightly increased estimates and valuation range
With a slightly stronger-than-expected Q4 and a positive outlook for 2023 we have increased our EBITDA estimates with c2% for 2023-24E. Coupled with slightly higher growth expectations, we also raise the valuation range where the new base case stands at SEK1,600 (SEK1,500) with a bull case of SEK2,600 (SEK2,400) and a bear case of SEK1,200 (SEK1,100).
| EURm | 2020 | 2021 | 2022 | 2023e | 2024e |
| Revenues | 561.4 | 1,068.8 | 1,456.7 | 1,845.0 | 2,210.6 |
| Revenue Growth | 53.6% | 90.4% | 36.3% | 26.7% | 19.8% |
| EBITDA | 351.9 | 734.7 | 1,008.4 | 1,269.1 | 1,522.3 |
| EBIT | 319.4 | 654.1 | 908.1 | 1,130.8 | 1,356.5 |
| EBIT Margin | 56.9% | 61.2% | 62.3% | 61.3% | 61.4% |
| Net Income | 284.9 | 605.5 | 843.4 | 1,040.3 | 1,234.4 |
| EV/EBITDA | 41.6 | 36.0 | 21.9 | 20.2 | 16.4 |
| EV/EBIT | 45.8 | 40.5 | 24.4 | 22.7 | 18.4 |
Q4-results slightly above expectations
Evolution reported Q4 revenue of EUR408m compared to our estimate of EUR402m. Both Live and RNG revenue was somewhat higher than our expectations. Coming to the regional revenue mix, we are encouraged to see that Europe and North America came in above our expectations. Revenue from regulated markets stood at 40% compared to 41% in Q3 2022 and Q4 2021. EBITDA came in at EUR280m compared to our estimate of EYR278m. The EBITDA-margin was 69.2% while our estimate was 68.6%.
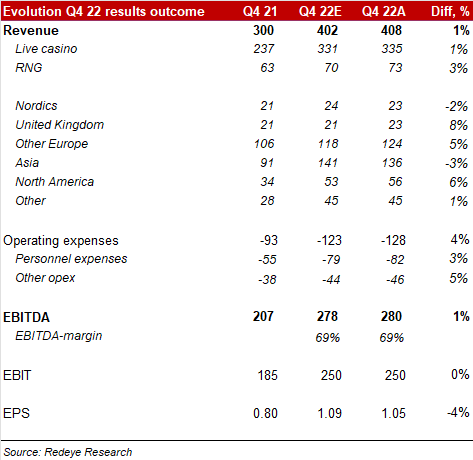
Strong margin guidance, albeit with wider range
Commenting on the profitability outlook for 2023, the company’s guidance is 68-71% which is wider range than earlier due to increased global uncertainty. However, this was strong compared to our expectation which was for a margin of around 68% for 2023E and we have slightly increased our margin assumption to around 69% for 2023E. We expect the margin to improve gradually over the year with a stronger margin in H2 2023E compared to H1 2023E.
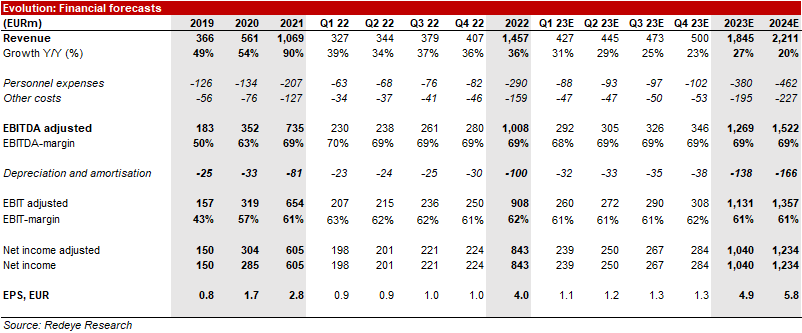
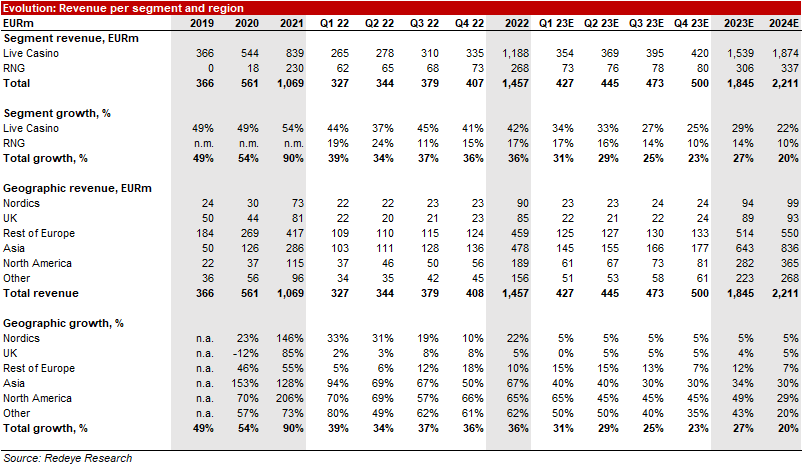
Slightly increased estimates
Overall, we have increased our revenue forecasts with c3% and EBITDA-estimates with c2 % for 2023-24E. We expect a gradual slowdown of growth in 2023-24E with topline growth of 27% and 20% for 2023-24E (slightly higher than our previous forecast of 24% and 20% respectively). The table below summarises key financials and regional revenue for 2019-2024E.
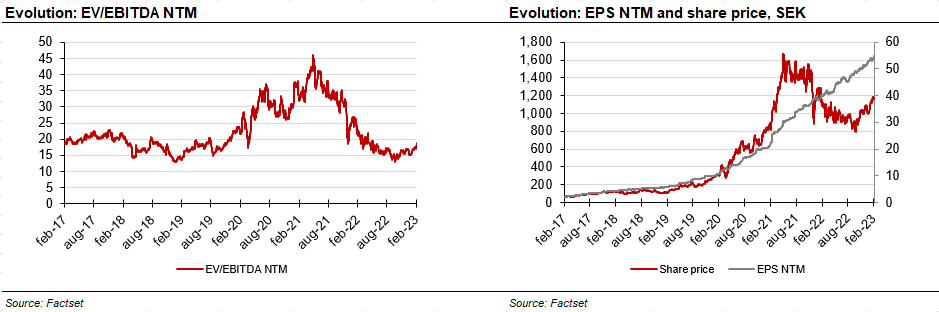
Valuation
On the back of the increased estimates, we have also raised our valuation range where the new base case stands at SEK1,600 (SEK1,500) with a bull case of SEK2,600 (SEK2,400) and a bear case of SEK1,200 (SEK1,100). Looking at the current valuation compared to the historical range, Evolution trades at around its average at 18-19x EV/EBITDA 2023E which looks attractive considering the continued positive earnings growth outlook. Our base case of SEK1,600 implies an EV/EBITDA of 24x 2023E and 20x 2024E.
Investment thesis
Case
Market leading platform company with long runway for growth
Evidence
Strong track record and large market opportunity
Challenge
Emerging competition and regulatory risks
Valuation
Base case DCF supported by strong growth and profitability
Summary Redeye Ratings
The rating consists of three valuation keys, each consituting an overall assesment of several factors that are rated on a scale of 0 to 1 points. The maximum score for a valuation key is 5 points.
People: 4
We judge management and the board as very capable. They bring solid experience and impressive track records in the industry, where several of them have extensive experience. We view the company's communication as transparent and honest. The company has a strong ownership structure with the board, management and founders having significant ownership, creating strong alignment with minority owners and supporting long-term shareholder value. Furthermore, the company has several institutional owners which we view as positive.
Business: 4
Evolution Gaming has an impressive track record with a market-leading position and a wide revenue base with rapid growth in all markets. It has defensive moats in both technology and organization supporting pricing power and an impressive return on capital.
Financials: 5
Evolution Gaming has a strong cash position and very solid cash flow, which supports it taking M&A opportunities. The company has an impressive return on both equity and invested capital. We expect that it will maintain strong profit margins and EPS growth in the years to come. The company has increased its dividend rapidly without jeopardising its financial position or growth possibilities.
| Income statement | |||||
| EURm | 2020 | 2021 | 2022 | 2023e | 2024e |
| Revenues | 561.4 | 1,068.8 | 1,456.7 | 1,845.0 | 2,210.6 |
| Cost of Revenue | 0.00 | 0.00 | 0.00 | 0.00 | 0.00 |
| Operating Expenses | 209.5 | 334.1 | 448.3 | 575.9 | 688.3 |
| EBITDA | 351.9 | 734.7 | 1,008.4 | 1,269.1 | 1,522.3 |
| Depreciation | 0.00 | 0.00 | 0.00 | 9.2 | 11.1 |
| Amortizations | 32.5 | 80.6 | 100.4 | 129.2 | 154.7 |
| EBIT | 319.4 | 654.1 | 908.1 | 1,130.8 | 1,356.5 |
| Shares in Associates | 0.00 | 0.00 | 0.00 | 0.00 | 0.00 |
| Interest Expenses | 0.99 | 6.5 | 0.00 | 0.00 | 0.00 |
| Net Financial Items | -0.99 | -6.5 | -1.5 | 0.00 | 0.00 |
| EBT | 299.0 | 647.5 | 906.6 | 1,130.8 | 1,356.5 |
| Income Tax Expenses | 14.1 | 42.1 | 63.2 | 90.5 | 122.1 |
| Net Income | 284.9 | 605.5 | 843.4 | 1,040.3 | 1,234.4 |
| Balance sheet | |||||
| Assets | |||||
| Non-current assets | |||||
| EURm | 2020 | 2021 | 2022 | 2023e | 2024e |
| Property, Plant and Equipment (Net) | 62.3 | 80.2 | 111.0 | 175.6 | 252.9 |
| Goodwill | 1,834.3 | 2,188.5 | 2,315.3 | 2,315.3 | 2,315.3 |
| Intangible Assets | 727.6 | 757.3 | 742.9 | 659.9 | 560.4 |
| Right-of-Use Assets | 39.7 | 54.3 | 67.9 | 67.9 | 67.9 |
| Other Non-Current Assets | 6.0 | 13.5 | 22.8 | 22.8 | 22.8 |
| Total Non-Current Assets | 2,669.9 | 3,093.7 | 3,260.0 | 3,241.5 | 3,219.4 |
| Current assets | |||||
| EURm | 2020 | 2021 | 2022 | 2023e | 2024e |
| Inventories | 0.00 | 0.00 | 0.00 | 0.00 | 0.00 |
| Accounts Receivable | 120.5 | 200.7 | 277.0 | 369.0 | 442.1 |
| Other Current Assets | 157.1 | 187.3 | 299.8 | 369.0 | 442.1 |
| Cash Equivalents | 221.7 | 421.4 | 532.6 | 1,135.5 | 1,824.3 |
| Total Current Assets | 499.2 | 809.4 | 1,109.4 | 1,873.5 | 2,708.5 |
| Total Assets | 3,169.1 | 3,903.1 | 4,369.4 | 5,115.0 | 5,928.0 |
| Equity and Liabilities | |||||
| Equity | |||||
| EURm | 2020 | 2021 | 2022 | 2023e | 2024e |
| Non Controlling Interest | 0.00 | 0.00 | 0.00 | 0.00 | 0.00 |
| Shareholder's Equity | 2,726.2 | 3,191.0 | 3,460.3 | 4,074.2 | 4,788.4 |
| Non-current liabilities | |||||
| EURm | 2020 | 2021 | 2022 | 2023e | 2024e |
| Long Term Debt | 0.00 | 0.00 | 0.00 | 0.00 | 0.00 |
| Long Term Lease Liabilities | 38.1 | 53.2 | 65.2 | 65.2 | 65.2 |
| Other Non-Current Lease Liabilities | 36.7 | 288.8 | 418.0 | 418.0 | 418.0 |
| Total Non-Current Liabilities | 74.8 | 342.0 | 483.2 | 483.2 | 483.2 |
| Current liabilities | |||||
| EURm | 2020 | 2021 | 2022 | 2023e | 2024e |
| Short Term Debt | 0.00 | 0.00 | 0.00 | 0.00 | 0.00 |
| Short Term Lease Liabilities | 11.9 | 14.6 | 14.4 | 14.4 | 14.4 |
| Accounts Payable | 15.3 | 8.6 | 10.1 | 36.9 | 44.2 |
| Other Current Liabilities | 341.0 | 346.9 | 401.4 | 506.3 | 597.7 |
| Total Current Liabilities | 368.2 | 370.1 | 425.9 | 557.6 | 656.4 |
| Total Liabilities and Equity | 3,169.1 | 3,903.1 | 4,369.4 | 5,115.0 | 5,928.0 |
| Cash flow | |||||
| EURm | 2020 | 2021 | 2022 | 2023e | 2024e |
| Operating Cash Flow | 316.1 | 598.9 | 877.5 | 1,149.2 | 1,352.7 |
| Investing Cash Flow | -36.9 | -155.7 | -371.6 | -119.9 | -143.7 |
| Financing Cash Flow | 0.00 | -248.5 | -394.2 | -426.4 | -520.1 |
Disclosures and disclaimers