Sensys Gatso: Temporary Weakness to Turn to Strength in Late 2023
Research Update
2023-05-02
07:25
Redeye thinks that Sensys Gatso currently displays extraordinarily low sales and an extraordinarily high cost base. From late 2023, Redeye thinks the cost base will normalize and that revenues will rather be somewhat heightened. This indicates strong revenue growth combined with a hefty margin expansion that will likely attract many investors. Redeye lowers its valuation range.
JVK
Jesper Von Koch
Weak Q1 financials caused by low System Sales and temporarily heightened cost base
In Q1, sales was low due to low System Sales - which will always be volatile. We had anticipated revenues from both Trafikverket in Sweden and the order from the Netherlands to turn into revenues already in Q1, which is the main reason for sales missing our estimates. At the same time, the qualitative TRaaS revenue continued its strong growth trajectory. Also, a temporarily heightened cost base caused poor profitability in Q1.
Revenue growth and margin expansion from H2
Sensys Gatso expects the Netherlands order to start generating revenue from Q3 (or Q4), and that the Trafikverket order will generate revenues from Q4. When these start generating revenues, the development projects for this, which currently causes a heightened cost base, will be over. We think this will bring a nice combination of lower costs and higher revenues, resulting in revenue growth and margin expansion.
Base Case likely to be realized during 2024
Redeye makes downward adjustments for its 2023 estimates but raises estimates for 2024. We think the strong revenue growth and margin expansion from Q4 2023 to the end of 2024 will attract much investor interest. Hence, entering the shares ahead of this journey could be interesting. We guess the gap between the share price and our Base Case will close during this period. After lowering estimates and raising our WACC from 11.0% to 11.5%, we lower our fair value range. Our Base Case is SEK1.4 (1.6), Bear Case is SEK0.7 (0.9), and Bull Case is SEK2.1 (2.5).
Key financials
| SEKm | 2021 | 2022 | 2023e | 2024e | 2025e |
| Revenues | 506.8 | 494.7 | 534.6 | 705.5 | 695.5 |
| Revenue Growth | 11.4% | -2.4% | 8.1% | 32.0% | -1.4% |
| EBITDA | 77.9 | 73.7 | 34.4 | 115.0 | 111.0 |
| EBIT | 40.3 | 31.0 | -5.8 | 73.0 | 69.0 |
| EBIT Margin | 7.9% | 6.3% | -1.1% | 10.4% | 9.9% |
| Net Income | 36.2 | 20.2 | -10.7 | 55.8 | 55.6 |
| EV/Revenue | 1.6 | 1.6 | 1.7 | 1.3 | 1.2 |
| EV/EBIT | 19.9 | 25.7 | -159 | 12.4 | 12.5 |
| P/E | 23.9 | 42.7 | -74.3 | 15.8 | 16.7 |
Review of Q1: Weak profitability caused by low System Sales and temporarily heightened cost base
The quarterly figures came in below Redeye’s estimates on top line, and well below on EBIT. Weak System Sales and a temporarily heightened cost base caused the poor profitability.
Sensys Gatso: Outcome vs estimates
| SEKm | Q1'23A | Q1'23E | Last year | Beat/ Miss | y/y diff |
| Net sales | 113 | 152 | 114 | -26% | 0% |
| - of which System Sales | 27 | 64 | 44 | -58% | -39% |
| - of which Service & Maintenance | 36 | 33 | 27 | 11% | 31% |
| - of which Managed Services | 51 | 55 | 42 | -8% | 22% |
| Gross margin | 40% | 42% | 45% | -5% | -5% |
| OPEX incl. D&A | 54 | 53 | 46 | 2% | 17% |
| EBIT | -8.6 | 10.4 | 5.7 | -183% | -251% |
| EBIT margin | -7.6% | 6.8% | 5.0% |
Top line: Weak System Sales but strong TRaaS
Managed Services: Dampened revenues from weather effects in the USA
Managed Services incl. Licenses amounted to SEK50.7m (+22% y/y) and accounted for 45% of sales in the quarter. Revenues were impacted negatively by heavy snowstorms in the USA, causing fewer cars on the roads and thus fewer tickets. The company did not quantify the effect but we estimate a c5% negative impact.
Source: Sensys Gatso
We continue to see a bright future for this part, both short and long-term. Particularly, we expect more and somewhat larger cities to be added to Sensys Gatso's list of customers. Investments in the sales organization have already been taken, resulting in a higher cost base. Now, we await the reaping of the fruits. Also, new markets outside the USA (like the examples from Australia, Ghana, and Colombia) are also likely to drive growth.
Service & Maintenance: Good development but boosted by replacements from demolishment
Sales from Service & Maintenance came in c10% above our estimates, landing at SEK36.0m, +31% y/y. Sales was, however, boosted by one-off replacements in Sweden and the Netherlands, which both had to replace cameras that had been demolished. Service & Maintenance accounted for 32% of sales in the quarter, meaning that TRaaS revenues accounted for 76% of total revenues. This business area continues to accumulate contracts as more systems are delivered, which makes this kind of revenue predictable and stable.
Managed Services: Quarterly revenue, SEKm
Source: Sensys Gatso
Just as for Managed Services, we believe both the short and long-term future look bright. Looking ahead, we see a smaller boost of revenues in 2024 from the large contract from the Netherlands.
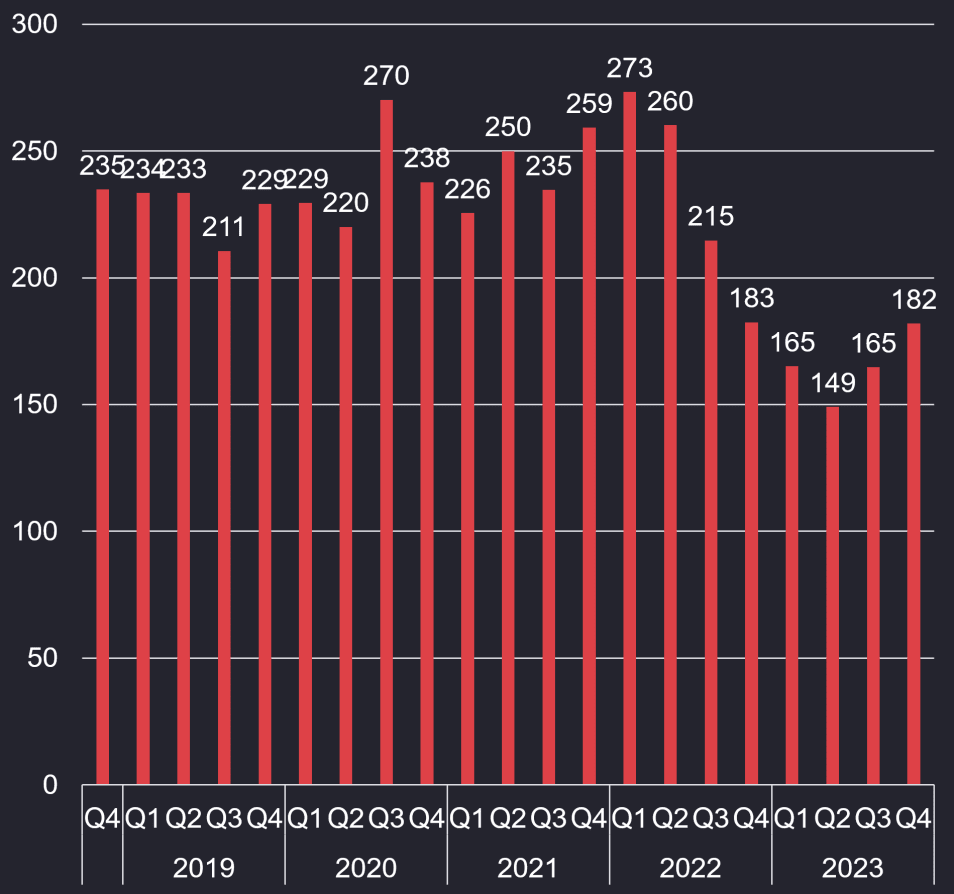
System Sales: Poor quarter without sales from Sweden or the Netherlands
System Sales continues to be lumpy – as is its nature. Q1 came in at only SEK27m, -39% y/y. System sales accounted for only 24% of sales in the quarter. Compared to last year, there were no revenues from either Sweden or Saudi Arabia. Compared to our estimates, we had anticipated revenue generation from both Sweden and the Netherlands.
As we continuously state, investors should look at revenues on a rolling-12-months basis, which shows that revenues are developing well. In its nature, this segment has quite lumpy deliveries and timing is depending on requirements from the customers. As such, even Sensys Gatso itself cannot estimate sales on a quarterly basis. Therefore, we strongly urge investors to look at this segment on a rolling-12-months basis. See below:
System Sales: Quarterly revenue, SEKm
System Sales: Rolling twelve months, SEKm

Source: Sensys Gatso
Source: Sensys Gatso
Looking ahead, the company’s order book is strong. First, there is 25% left of the SEK 275m Saudi Order. The remaining SEK69m is estimated to be delivered in H2 2023, but the timing is outside of Sensys Gatso's own control. We estimate some of this to be moved to 2024. Also, we estimate that the large contract from the Netherlands will contribute to SEK25m in 2023 and cSEK100m in 2024. Last, Sensys Gatso expects the large order from Trafikverket in Sweden to generate revenues from Q4 2023.
Also, we see a good chance of Sensys Gatso winning an additional contract for speed and red-light cameras from the same Saudi customer. The potential order for this new area can be much larger that the current order of SEK275m. Hence, this could be an important short-term trigger. The company stated that it is currently going through a testing period for this application for the Saudi customer.
Gross margin: Low despite high share of TRaaS - impacted by prolonged project deliveries
The gross margin was slightly below our estimates in the quarter, landing at 40%. Despite a higher-than-expected share of high-margin TRaaS revenues, it was lower than we anticipated. The company stated that prolonged project deliveries caused higher costs of goods sold (COGS) than normal. As a reminder, Managed Services have a considerably higher gross margin than System Sales. However, new go-lives in Managed Services imply a cost for setting up new cameras, which temporarily hurts the gross margin. Thus, the gross margin was lower than a 'normalized' level.
Gross margin - per quarter and last twelve months
Source: Sensys Gatso
Looking ahead, we expect continued heightened COGS in Q2 and Q3, causing a rather low gross margin. From Q4, we expect this effect to go away, but the gross margin will then be weighed from a higher share of System Sales.
However, long-term, we expect the gross margin to increase as the TRaaS business constitutes a larger part of total sales.
Cost base: OPEX incl. D&A at SEK54m
OPEX incl. depreciation and amortization was SEK53.8m, just below estimates. Also, the company had SEK20m in CAPEX compared to a more normalized level of cSEK7m per quarter. The total underlying cost base was thus cSEK64m (53.8m, less D&A of 10m, plus 20m CAPEX). The company reported that the cost base is temporarily heightened due to temporary consultants in R&D to enable fast deliveries to the Netherlands and Trafikverket. In practice, the company is completing its development of FLUX which will make deployment and delivery more scalable. Hence, expect a normalized cost base of cSEK54m by Q3 and then possibly even lower due to scalability.
Operating expenses incl. D&A, SEKm
Source: Sensys Gatso
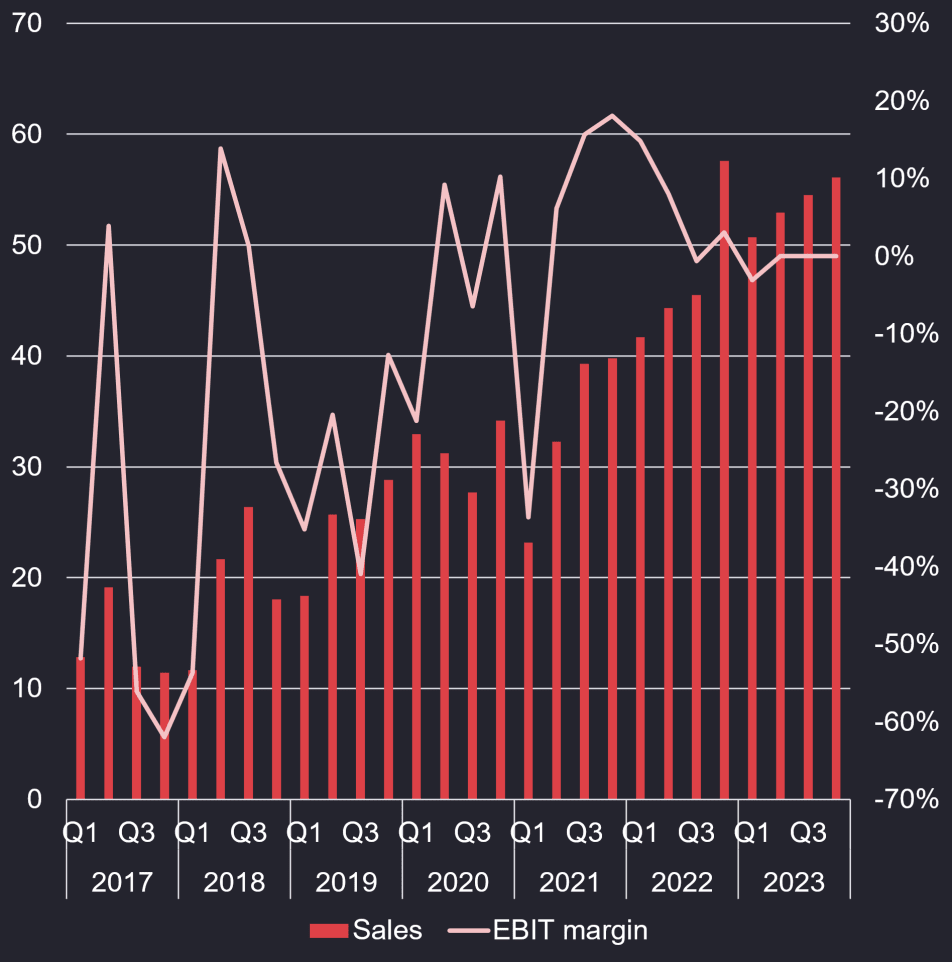
Profitability: Temporarily low revenues and high costs caused poor profitability
EBIT margin landed at -7.6% in the quarter. As already mentioned, the temporarily low System Sales and heightened cost base together caused poor profitability. Also, the company’s expansion of its sales force in the USA is hurting the company’s profitability and will likely continue to do so throughout 2023.
Looking at the below chart, we see that the quarterly EBIT margin is lumpy due to the lumpiness of System Sales. More important is to note the ongoing margin improvement. We believe this will continue as the company grows with an increasing share of TRaaS revenue. With a larger base of high-margin recurring revenues, we think Sensys Gatso will become increasingly attractive to investors.
EBIT margin - per quarter and last twelve months
Source: Sensys Gatso
To see the underlying reality of what has happened to the business, we think the following chart is worthwhile. As can be seen below, the margin improvements have come from both a scaling OPEX and an improved gross margin. However, OPEX has come up as a consequence of lower System Sales and investments in the US sales organization.
Costs as % of revenues
Source: Sensys Gatso
We think profitability will show big improvements starting in late 2023. Then, we expect System Sales to be strong (helped by Saudi, Sweden, and the Netherlands) and that costs will come down to a more normalized level.
EBIT contribution per business area: Dampened performance from both legs
In this section, Service & Maintenance is included in System Sales.
Managed Services – LTM 1.8% EBIT margin, dampened by current sales investments
Revenues for Managed Services are predictable, but profitability is lumpy since installation costs are included in the cost base when a new city enters production mode. Due to the high gross margin (est. 60%), there is a high operating leverage in the business model. Thus, the margin expands when sales increases as a direct consequence of a rather fixed OPEX base.
The EBIT margin for the last twelve months is now down at 1.8%. The reason why is the company's substantial investments in its sales team, causing a heightened cost base. See below for a quarterly and LTM overview.
Managed Services: Quarterly revenue and margin
Managed Services: LTM revenue and margin
Source: Sensys Gatso

Source: Sensys Gatso
System Sales (inc. Service & Maintenance) – LTM 4.4% EBIT margin – currently dampened by heightened cost base and low System Sales
Revenues for System Sales, which in these terms include Service & Maintenance, are lumpy. However, the share of Service & Maintenance, which is generally recurring, has increased from 22% in 2018 to above 40% today. This has contributed to two things: 1) less lumpy revenues and 2) higher profitability. See below.
System Sales, incl. Service: Q revenue and margin
System Sales: LTM revenue and margin

Source: Sensys Gatso

Source: Sensys Gatso
However, the major margin improvement is likely not only due to an increased share of aftermarket revenues. We also believe the company has gained general efficiency improvements over the years.
Financial position: Solid
By the end of Q1, Sensys Gatso had a strong financial position with SEK72m in cash balance and very little debt. While we think a smaller acquisition may be likely within two years, we do not think it will happen during 2023.
Ongoing larger contracts
Looking at the company’s large orders, we have the following orders that are noteworthy:
| Overview of major ongoing projects, SEKm | ||||||||||
| Country | Order date | Total value | Value System Sales | Value Serv. & Maint. | Value Man. Serv. | ARR contribution | Revenue start | Contract duration | Possible extension | Comment |
| Saudi | Aug'20 | 275 | 275 | 0 | 0 | 0 | Q3'20 | N/A | N/A | On pause. Last 25% in H2'23 |
| Costa Rica | 192 | 132 | 60 | 0 | 15 | ? | N/A | N/A | Postponed. Rollout on municipality level first | |
| Netherlands | Mar'22 | 250 | 125 | 125 | 0 | 21 | 2,023 | 6 years | 12 years | System sales starts in Q3'23 |
| Australia | May'22 | 74 | 0 | 0 | 74 | 25 | Q4'22 | 2 years | 1 year | |
| Ghana | Dec'22 | 800 | 0 | 0 | 800 | 34 | H2'24 | 9.5 years | 800m total contract value, but only 40% to Sensys Gatso | |
| Sweden | Oct'22 | 850 | 425 | 425 | 0 | 35 | Q4'22 | 12 years | 2+2+2 years after first 6 years | System sales starts in Q4'23. Est. 80m per year from 2024 to 2028, then 32m. Service increase from 2m in 2023 to 40m in 2034. |
Changes to financial estimates
Managed Services
- Lowering 2023 estimates by 7%, then by 10-13% for 2024-2026E.
Service & Maintenance
- Small upward estimate adjustment by +2% per year.
System Sales
- Significantly lowering Q2 and Q3 estimates, but raising estimates for Q4 and 2024. The, somewhat lowering estimates for 2025E and 2026E.
Costs and margins
- OPEX estimates were raised for 2023E, but maintained for 2024-2026E.
- Slightly lowering gross margin estimates due to a lower share of Managed Services in the product mix.
- Our estimated EBIT for 2023 is changed from SEK45 to a small loss. For 2024E, we raise our EBIT estimates by 13%. For 2025-206E, we lower EBIT estimates by 20-25% due to lower expected sales.
Estimate changes per business area
| SEKm | 2021 | 2022 | Q1 23 | Q2 23E | Q3 23E | Q4 23E | 2023E | 2024E | 2025E | 2026E |
| System Sales | 259 | 183 | 27 | |||||||
| New | 35 | 35 | 85 | 182 | 300 | 240 | 240 | |||
| Old | 64 | 64 | 64 | 256 | 243 | 250 | 250 | |||
| Change | -45% | -45% | 33% | -29% | 23% | -4% | -4% | |||
| Service & Maintenance | 113 | 123 | 36 | |||||||
| New | 33 | 34 | 35 | 138 | 155 | 167 | 167 | |||
| Old | 33 | 34 | 35 | 135 | 152 | 164 | 164 | |||
| Change | 0% | 0% | 0% | 2% | 2% | 2% | 2% | |||
| Managed Services | 135 | 189 | 51 | |||||||
| New | 53 | 54 | 56 | 214 | 251 | 288 | 331 | |||
| Old | 57 | 59 | 60 | 232 | 278 | 333 | 383 | |||
| Change | -7% | -7% | -7% | -7% | -10% | -13% | -13% |
Estimate changes
| SEKm | 2021 | 2022 | Q1 23 | Q2 23E | Q3 23E | Q4 23E | 2023E | 2024E | 2025E | 2026E |
| Total net sales | 507 | 495 | 114 | |||||||
| New | 121 | 124 | 176 | 535 | 706 | 696 | 763 | |||
| Old | 154 | 157 | 159 | 623 | 672 | 747 | 821 | |||
| Change | -21% | -21% | 10% | -14% | 5% | -7% | -7% | |||
| Gross margin | 39% | 45% | 40% | |||||||
| New | 40% | 40% | 40% | 40% | 42% | 43% | 44% | |||
| Old | 42% | 42% | 42% | 42% | 43% | 44% | 45% | |||
| Change | -2% | -2% | -2% | -2% | -1% | -1% | -1% | |||
| OPEX | 118 | 151 | 44 | |||||||
| New | 45 | 46 | 47 | 181 | 180 | 191 | 200 | |||
| Old | 42 | 43 | 44 | 170 | 180 | 192 | 201 | |||
| Change | 7% | 7% | 7% | 7% | 0% | -1% | -1% | |||
| EBITDA | 78 | 74 | 2 | |||||||
| New | 4 | 4 | 24 | 34 | 115 | 111 | 138 | |||
| Old | 23 | 23 | 23 | 91 | 110 | 138 | 169 | |||
| Change | -81% | -82% | 5% | -62% | 4% | -19% | -18% | |||
| D&A | 38 | 43 | 10 | |||||||
| New | 10 | 10 | 10 | 40 | 42 | 42 | 42 | |||
| Old | 11 | 11 | 11 | 46 | 46 | 46 | 46 | |||
| Change | -12% | -12% | -12% | -12% | -8% | -8% | -8% | |||
| EBIT | 40 | 31 | -8 | |||||||
| New | -6 | -6 | 14 | -6 | 73 | 69 | 96 | |||
| Old | 11 | 11 | 11 | 45 | 65 | 92 | 123 | |||
| Change | -150% | -152% | 23% | -113% | 13% | -25% | -22% | |||
| EBIT (%) | 8% | 6% | -7% | |||||||
| New | -5% | -5% | 8% | -1% | 10% | 10% | 13% | |||
| Old | 7% | 7% | 7% | 7% | 10% | 12% | 15% | |||
| Change | -12% | -12% | 1% | -8% | 1% | -2% | -2% |
Financial estimates
| SEKm | 2021 | 2022 | Q1 23 | Q2 23E | Q3 23E | Q4 23E | 2023E | 2024E | 2025E | 2026E |
| Revenues | 507 | 495 | 114 | 121 | 124 | 176 | 535 | 706 | 696 | 763 |
| - System Sales | 259 | 183 | 27 | 35 | 35 | 85 | 182 | 300 | 240 | 247 |
| - Service & Maintenance | 113 | 123 | 36 | 33 | 34 | 35 | 138 | 155 | 167 | 184 |
| - Managed Services incl. Licenses | 135 | 189 | 51 | 53 | 54 | 56 | 214 | 251 | 288 | 331 |
| Gross Profit | 196 | 225 | 46 | 49 | 50 | 71 | 215 | 295 | 302 | 338 |
| EBITDA | 78 | 74 | 2 | 4 | 4 | 24 | 34 | 115 | 111 | 138 |
| EBIT | 40 | 31 | -8 | -6 | -6 | 14 | -6 | 73 | 69 | 96 |
| EPS (SEK) | 0.04 | 0.02 | -0.014 | -0.005 | -0.005 | 0.012 | -0.01 | 0.06 | 0.06 | 0.08 |
| Growth (%) | 11% | -2% | 0% | -3% | 30% | 9% | 8% | 55% | -1% | 10% |
| Gross margin | 39% | 45% | 40% | 40% | 40% | 40% | 40% | 42% | 43% | 44% |
| EBITDA margin (%) | 15% | 15% | 2% | 3% | 3% | 14% | 6% | 16% | 16% | 18% |
| EBIT margin (%) | 8% | 6% | -7% | -5% | -5% | 8% | -1% | 10% | 10% | 13% |
| Net income margin (%) | 7% | 4% | -12% | -4% | -4% | 6% | -2% | 8% | 7% | 10% |
Fair value range
| Assumptions, fair value range | |||
| Bear Case | Base case | Bull case | |
| Value per share, SEK | 0.7 | 1.4 | 2.1 |
| CAGR 2022-2026 per segment | |||
| Managed Services | 7% | 15% | 17% |
| Service & Maintenance | 3% | 11% | 13% |
| System Sales | 4% | 7% | 9% |
| Total | 3% | 11% | 14% |
| Total sales 2027 | 702 | 843 | 922 |
| EBIT margin 2027 | 10% | 16% | 21% |
| Avg EBIT margin 2023-2027 | 3% | 9% | 14% |
| WACC | 11.5% | 11.5% | 11.5% |
| 2023-2028 | 2029-2034 | ||
| 319 | 106 |
Investment thesis
Case
Growing recurring revenue with higher margin
Evidence
Potential in expanding its strong position
Challenge
Cost base for two business areas has historically been hard to handle
Valuation
Base Case at SEK 1.4 - we think the gap between price and value will be closed during 2024
Quality Rating
People: 4
The Gatso acquisition in summer 2015 was a logical acquisition of stability in the form of a high proportion of much-needed recurring revenue, but the order intake has not been convincing until recently. Sensys Gatso’s CEO has worked in entirely different industries, but parts of the management team have extensive experience from working a long time for Gatso, although the old Sensys management team has left. An incentive scheme is reserved for global management and selected employees. In conjunction with the acquisition, Sensys Gatso gained an industrial principal shareholder. The former Gatso management holds ~17% of the shares and has committed operationally to the management. Shareholdings among the rest of the management are still too low, in our opinion. All members of the board own shares, but the size of the board members' holdings generally are too small.
Business: 4
More than half of Sensys Gatso’s revenues are recurring in the shape of Managed Services and service and maintenance sales. These revenues are both sticky and of a high-margin character. Competition remains intense even after the Gatso acquisition and the European market may need consolidation. While the company has an interesting position as a market leader on the system side, we think Managed Services comprises the true jewel of the company. The business is resilient against economic ups and downs and may actually benefit in tougher times when countries with budget deficits look for new sources of income. It should however be noted that the market conditions are largely affected by the volatile political climate.
Financials: 3
After a long history with weak profitability, Sensys Gatso turned profitable on a 12months basis in 2020 and has since only improved margins. The company also has a healthy balance sheet with a net cash position. The dependence on individual large deals has also been reduced as the majority of the company’s revenues are now recurring. For an even higher rating, a longer streak of profitability is required with further enhanced margins.
Financials
| Income statement | |||||
| SEKm | 2021 | 2022 | 2023e | 2024e | 2025e |
| Revenues | 506.8 | 494.7 | 534.6 | 705.5 | 695.5 |
| Cost of Revenue | 310.5 | 269.6 | 319.5 | 410.8 | 393.8 |
| Operating Expenses | 118.3 | 151.4 | 180.8 | 179.7 | 190.8 |
| EBITDA | 77.9 | 73.7 | 34.4 | 115.0 | 111.0 |
| Depreciation | 0.00 | 0.00 | 0.00 | 0.00 | 0.00 |
| Amortizations | 37.6 | 41.4 | 40.0 | 40.0 | 40.0 |
| EBIT | 40.3 | 31.0 | -5.8 | 73.0 | 69.0 |
| Shares in Associates | 1.3 | 0.00 | 0.00 | 0.00 | 0.00 |
| Interest Expenses | 4.8 | 10.1 | 7.0 | 4.0 | 4.0 |
| Net Financial Items | 3.7 | 2.3 | -7.0 | -4.0 | -4.0 |
| EBT | 43.9 | 33.2 | -12.7 | 69.0 | 65.0 |
| Income Tax Expenses | 7.8 | 13.0 | -1.1 | 14.2 | 13.4 |
| Net Income | 36.2 | 20.2 | -10.7 | 55.8 | 55.6 |
| Balance sheet | |||||
| Assets | |||||
| Non-current assets | |||||
| SEKm | 2021 | 2022 | 2023e | 2024e | 2025e |
| Property, Plant and Equipment (Net) | 59.3 | 70.6 | 75.6 | 79.6 | 83.6 |
| Goodwill | 242.1 | 276.7 | 276.7 | 276.7 | 276.7 |
| Intangible Assets | -1.4 | 0.00 | 19.8 | 7.8 | -4.2 |
| Right-of-Use Assets | 9.9 | 0.00 | 0.00 | 0.00 | 0.00 |
| Other Non-Current Assets | 0.00 | 143.6 | 0.00 | 0.00 | 0.00 |
| Total Non-Current Assets | 311.2 | 490.9 | 372.2 | 364.2 | 356.2 |
| Current assets | |||||
| SEKm | 2021 | 2022 | 2023e | 2024e | 2025e |
| Inventories | 96.8 | 85.2 | 106.9 | 141.1 | 139.1 |
| Accounts Receivable | 141.3 | 67.4 | 96.2 | 119.9 | 111.3 |
| Other Current Assets | 50.6 | 85.0 | 42.8 | 56.4 | 55.6 |
| Cash Equivalents | 72.5 | 99.7 | -24.5 | -12.9 | 35.5 |
| Total Current Assets | 361.1 | 337.3 | 221.4 | 304.6 | 341.6 |
| Total Assets | 672.3 | 828.3 | 593.6 | 668.7 | 697.7 |
| Equity and Liabilities | |||||
| Equity | |||||
| SEKm | 2021 | 2022 | 2023e | 2024e | 2025e |
| Non Controlling Interest | -2.0 | 0.00 | 0.00 | 0.00 | 0.00 |
| Shareholder's Equity | 552.7 | 626.1 | 605.3 | 666.4 | 694.1 |
| Non-current liabilities | |||||
| SEKm | 2021 | 2022 | 2023e | 2024e | 2025e |
| Long Term Debt | 8.8 | 22.0 | 22.0 | 22.0 | 22.0 |
| Long Term Lease Liabilities | 28.2 | 22.3 | 22.3 | 22.3 | 22.3 |
| Other Long Term Liabilities | 28.5 | 30.8 | 30.8 | 30.8 | 30.8 |
| Total Non-Current Liabilities | 65.5 | 75.0 | 75.0 | 75.0 | 75.0 |
| Current liabilities | |||||
| SEKm | 2021 | 2022 | 2023e | 2024e | 2025e |
| Short Term Debt | 0.00 | 8.8 | 8.8 | 8.8 | 8.8 |
| Short Term Lease Liabilities | 10.0 | 10.5 | 10.5 | 10.5 | 10.5 |
| Accounts Payable | 37.1 | 20.4 | 37.4 | 49.4 | 48.7 |
| Other Current Liabilities | 50.7 | 87.5 | 0.00 | 0.00 | 0.00 |
| Total Current Liabilities | 97.8 | 127.2 | 56.8 | 68.7 | 68.0 |
| Total Liabilities and Equity | 714.0 | 828.3 | 737.0 | 810.2 | 837.1 |
| Cash flow | |||||
| SEKm | 2021 | 2022 | 2023e | 2024e | 2025e |
| Operating Cash Flow | -2.7 | 184.7 | -49.3 | 38.2 | 108.4 |
| Investing Cash Flow | -42.0 | -35.6 | -64.8 | -32.0 | -32.0 |
| Financing Cash Flow | 0.00 | -18.1 | -10.1 | 5.3 | -27.9 |
Rating definitions
The team
Disclosures and disclaimers