Active Biotech Q1 2023: New Results from naptumomab
Research Update
2023-05-04
11:43
Redeye comments on Active Biotech’s Q1 report. After the end of Q1, results from naptumomab’s phase I/IIa study with durvalumab were published which we discuss.
RR
Richard Ramanius
Contents
Investment thesis
Quality Rating
Discussion
Financial results
Valuation
Financials
Rating definitions
The team
Download article
Naptumomab
New results from the phase I/IIa study combining naptumomab with durvalumab (PD-L1 blocker) were presented at the AACR meeting. The recommended phase II dose was reached at 10 mcg/kg, limited toxicity was shown and pre-treatment with obinutuzumab will likely reduce the formation of anti-drug antibodies and preserve naptumomab plasma levels. Despite a very difficult-to-treat patient group, early signs of efficacy were seen with two complete and two partial responses.
Tasquinimod & Laquinimod
New data from the ongoing study in multiple myeloma (a type of blood cancer) will be presented at the ASCO meeting in early June 2023. Interim safety and preliminary activity results will be presented both from the single agent arm and in combination with ixazomib, lenalidomide and dexamethasone (IRd). The phase I trial of laquinimod was completed in January, and a full analysis is ongoing. More detailed results will be published in H2 2023. A phase II study is scheduled for late 2023 subject to financing.
Lower Base Case
The cash position of SEK30m will last through 2023. Growth capital will be needed to maintain the progress of the unpartnered project portfolio. We push forward the projected launch dates of tasquinimod in MM and naptumomab in solid tumours by one year. Assuming some capital will be raised in 2023, our new fully diluted Base Case is SEK2.2 (3.0).
Key financials
| SEKm | 2020 | 2021 | 2022 | 2023e | 2024e |
| Revenues | 6.7 | 0.00 | 0.00 | 0.00 | 119.0 |
| Revenue Growth | -20.5% | -100% | nm. | nm. | nm. |
| EBITDA | -32.3 | -49.9 | -57.8 | -44.9 | 63.9 |
| EBIT | -32.3 | -49.9 | -57.8 | -44.9 | 63.9 |
| EBIT Margin | -482% | nm. | nm. | nm. | 53.7% |
| Net Income | -32.2 | -49.9 | -58.4 | -44.6 | 63.9 |
| EV/Revenue | 35.6 | nm. | nm. | nm. | 1.4 |
| EV/EBIT | -7.4 | -4.4 | -3.7 | -4.8 | 2.5 |
Investment thesis
Case
Three drug candidates with clinical data readouts and new trial initiations in 2023 will drive the share
Evidence
Repurposed, well-studied compounds reduce risks
Supportive Analysis
Challenge
Dilution risk
Challenge
Early-stage projects
Valuation
Large upside, risk spread over three projects
Quality Rating
People: 3
Management consists of a small, experienced team with extensive experience in clinical and business development. The CEO was previously Chief Scientific Officer at the company and led the research and clinical development of Active Biotech’s projects in neurodegenerative diseases and cancer. The board brings extensive and relevant international bio-pharma experience.
Business: 3
Active Biotech is a early to mid stage clinical-stage biotech company, developing first-in-class treatments in oncology and inflammatory eye disorders. Current commercial and academic partnerships enable low-cost development of tasquinimod (multiple myeloma) and naptumomab (solid tumors).
Financials: 0
Active Biotech has never generated any income from product sales and has not been profitable on an annual basis since 2001. The company raised SEK75m before costs for January 2021 in a rights issue. It raised SEK45m to fund operations in 2023.
Discussion
The main event after the quarter were the results were presented by NeoTX at the AACR meeting. We have now examined the abstract and poster. It was a comparably large phase I/IIa study with 19+7+33 patients (illustration below).
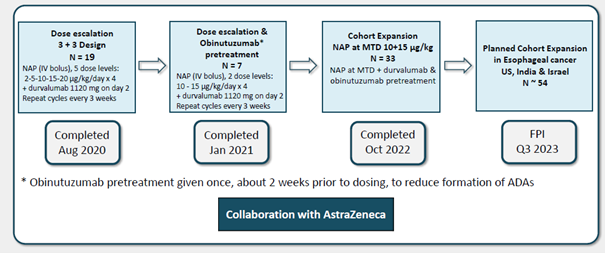
Source: NeoTX
The toxicity profile was favourable with mainly grade 1-2 adverse events (i.e. not serious) with no treatment discontinuation due to toxicity at the recommended phase II dose. Pre-treatment with obinutuzumab lead to a better plasma concentration of naptumomab. There were also some promising efficacy results. The two complete responses, one in pancreatic cancer and one in ovarian cancer, are interesting. In our original note, based on the AARC abstract, we calculated the disease control rate based on the total number of patients. We now have seen the poster. It is more correct to calculate the disease control rate based on the number of evaluable patients, which was 42. The disease control rate can thus be calculated as 19% (rather than 14%), and the objective response rate 9.5%, which looks somewhat more promising, considering the population recruited was very challenging to treat. 69% had pancreatic, ovarian or triple-negative breast cancers. These are aggressive cancers. Furthermore, patients had received a median of 3 prior lines of therapy. They were thus likely end-stage with a short remaining life expectancy. One would not expect a high response rate in such patients. It is, however, impossible to judge how much the PD-L1 inhibitor contributed, which, while usually not effective in this setting, can work for certain patients. Consequently, we do not change our estimates of naptumomab. The next step will be to recruit a cohort expansion in oesophageal cancer with around 54 patients starting in Q3 2023.
Furthermore, Active Biotech published new preclinical data demonstrating the mechanisms behind the anti-tumor activity of tasquinimod in blood-based cancers and NewTX published new preclinical data on naptumomab during the quarter.
Financial results
The company had no revenues in Q1. Operating costs were slightly lower than the previous quarter at SEK12m (the Q4 figure was 15) with a similar cash flow. The cash position at the end of the quarter was SEK30m (SEK42m).
Valuation
We have increased the development time of tasquinimod in multiple myeloma by one year, now assuming a market launch in 2029 (2028). We also assume a one-year later market launch of naptumomab in 2028 (2027). This, together with the smaller cash position, leads to a decrease in our Base Case to 2.8 (3.0). As the company’s cash position only finances operations until the end of this year, we have included dilution assuming some capital will be raised in 2023, leading to a fully diluted Base Case of SEK2.2 (3.0, non-diluted).
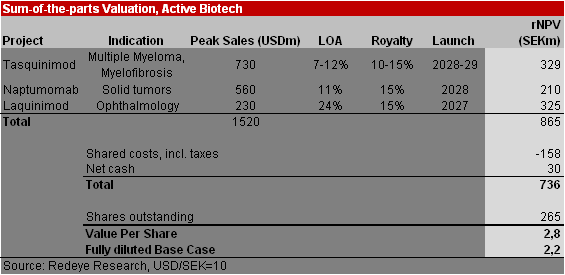
Our new Bull Case is SEK 3.2 and our Bear Case is SEK 1.3.
Financials
| Income statement | |||||
| SEKm | 2020 | 2021 | 2022 | 2023e | 2024e |
| Revenues | 6.7 | 0.00 | 0.00 | 0.00 | 119.0 |
| Cost of Revenue | 0.00 | 0.00 | 0.00 | 0.00 | 0.00 |
| Operating Expenses | 39.0 | 49.9 | 57.8 | 44.9 | 55.0 |
| EBITDA | -32.3 | -49.9 | -57.8 | -44.9 | 63.9 |
| Depreciation | 0.00 | 0.00 | 0.00 | 0.00 | 0.00 |
| Amortizations | 0.00 | 0.00 | 0.00 | 0.00 | 0.00 |
| EBIT | -32.3 | -49.9 | -57.8 | -44.9 | 63.9 |
| Shares in Associates | 0.00 | 0.00 | 0.00 | 0.00 | 0.00 |
| Interest Expenses | 0.00 | 0.00 | 0.70 | 0.00 | 0.00 |
| Net Financial Items | 0.10 | 0.00 | -0.60 | 0.30 | 0.00 |
| EBT | -32.2 | -49.9 | -58.4 | -44.6 | 63.9 |
| Income Tax Expenses | 0.00 | 0.00 | 0.00 | 0.00 | 0.00 |
| Net Income | -32.2 | -49.9 | -58.4 | -44.6 | 63.9 |
| Balance sheet | |||||
| Assets | |||||
| Non-current assets | |||||
| SEKm | 2020 | 2021 | 2022 | 2023e | 2024e |
| Property, Plant and Equipment (Net) | 0.00 | 0.00 | 6.3 | 6.3 | 6.3 |
| Goodwill | 0.00 | 0.00 | 0.00 | 0.00 | 0.00 |
| Intangible Assets | 0.00 | 0.00 | 0.20 | 0.20 | 0.20 |
| Right-of-Use Assets | 1.9 | 0.90 | 0.00 | 0.00 | 0.00 |
| Other Non-Current Assets | 0.00 | 0.00 | 0.40 | 0.00 | 0.00 |
| Total Non-Current Assets | 1.9 | 0.90 | 6.9 | 6.5 | 6.5 |
| Current assets | |||||
| SEKm | 2020 | 2021 | 2022 | 2023e | 2024e |
| Inventories | 0.00 | 0.00 | 0.00 | 0.00 | 0.00 |
| Accounts Receivable | 0.28 | 0.00 | 2.3 | 1.2 | 9.5 |
| Other Current Assets | 3.8 | 2.7 | 0.00 | 0.00 | 9.5 |
| Cash Equivalents | 26.2 | 53.1 | 41.8 | 47.2 | 112.3 |
| Total Current Assets | 30.3 | 55.8 | 44.1 | 48.4 | 131.3 |
| Total Assets | 32.1 | 56.7 | 51.0 | 54.9 | 137.8 |
| Equity and Liabilities | |||||
| Equity | |||||
| SEKm | 2020 | 2021 | 2022 | 2023e | 2024e |
| Non Controlling Interest | 0.00 | 0.00 | 0.00 | 0.00 | 0.00 |
| Shareholder's Equity | 22.1 | 47.9 | 34.5 | 39.9 | 103.8 |
| Non-current liabilities | |||||
| SEKm | 2020 | 2021 | 2022 | 2023e | 2024e |
| Long Term Debt | 0.69 | 0.00 | 0.00 | 0.00 | 0.00 |
| Long Term Lease Liabilities | 0.00 | 0.00 | 0.00 | 0.00 | 0.00 |
| Other Long Term Liabilities | 0.00 | 0.00 | 2.9 | 2.9 | 2.9 |
| Total Non-Current Liabilities | 0.69 | 0.00 | 2.9 | 2.9 | 2.9 |
| Current liabilities | |||||
| SEKm | 2020 | 2021 | 2022 | 2023e | 2024e |
| Short Term Debt | 1.3 | 8.7 | 0.00 | 0.00 | 10.9 |
| Short Term Lease Liabilities | 0.00 | 0.00 | 0.00 | 0.00 | 0.00 |
| Accounts Payable | 2.9 | 0.00 | 0.00 | 0.00 | 14.3 |
| Other Current Liabilities | 5.2 | 0.00 | 12.1 | 12.1 | 5.9 |
| Total Current Liabilities | 9.4 | 8.7 | 12.1 | 12.1 | 31.1 |
| Total Liabilities and Equity | 32.2 | 56.6 | 49.5 | 54.9 | 137.8 |
| Cash flow | |||||
| SEKm | 2020 | 2021 | 2022 | 2023e | 2024e |
| Operating Cash Flow | -32.2 | -46.2 | -54.9 | -44.6 | 65.1 |
| Investing Cash Flow | 0.00 | 0.00 | -0.20 | 0.00 | 0.00 |
| Financing Cash Flow | -1.3 | 74.1 | 43.7 | 50.0 | 0.00 |
Rating definitions
The team
Disclosures and disclaimers
Contents
Investment thesis
Quality Rating
Discussion
Financial results
Valuation
Financials
Rating definitions
The team
Download article