Physitrack: Steady state
Research Update
2023-08-16
07:30
Redeye updates its estimates and fair value range after Physitrack’s stable Q2 2023 report, which came in close to our forecasts. We find the c25% organic growth, combined with effective cost management in the face of ongoing challenging market conditions, to be encouraging. We raise our base case to SEK41(SEK38) per share.
JG
MS
Jessica Grunewald
Mark Siöstedt
Contents
Q2 Review
Financial Q2 2023: Revenues
Financial Qx 2023: Profitability and Cost base
Financial Qx 2023: Cash flows and Cash position
Other highlights from the report
Outlook
Estimate revisions
Estimates
Valuation
Quality Rating
Financials
Rating definitions
The team
Download article
Profitability focus
Revenues came in at EUR3.8m, with a y/y growth of 23%, and an organic growth of 25% y/y. However, this quarter’s comparables were challenging, especially for the Lifecare division. Organic growth was derived from both the Lifecare and Wellness divisions, which grew 9% and 66%, respectively, y/y. Adjusted EBITDA reached 25% in the quarter and 2pp below our estimate, amounting to cEUR1m. OPEX, excluding adjustments, amounted to EUR2.8m (EUR2.1), on par with our estimate. The management’s efforts towards enhancing operational efficiency have yielded positive outcomes, stabilising the cost base compared to the previous quarter.
All eyes are on the cashflow, liquidity at EUR2.8m
Cash flow from operating activities after adjusting items was EUR0.3m (EUR0.1m). By the end of Q2’23, Physitrack held a EUR0.7m cash position, but the available liquidity, including the Revolving Credit Facility (RCF) corresponds to EUR2.8m. Deferred consideration (non-current) was cEUR9m vs EUR10.7m in Q1, and capex continues to linger around EUR0.8m. Management “re-confirms that there is expected to be no further deferred contingent consideration payments for the remainder of the financial year, and no capital raising via share issuance or debt”. Further, management is confident that the business will be FCF positive by the end of the year. We expect Physitrack’s cash position combined with the RCF to be enough to reach positive cash flows and the RCF and FCF to cover further earn-outs. Nevertheless, our estimates allow for a little margin of error.
Small estimate changes, new base SEK41(SEK38) per share
We have made minor adjustments to our near-term estimates following Physitrack’s Q2 report. We decrease our sales forecasts by -1% for 2023e–2024e and lower our OPEX assumptions slightly. Reflecting our estimate revisions in combination with the increase of the EUR/SEK we adjust our fair value range to SEK12-80, with a base case of SEK41(SEK38) per share. Currently, Physitrack is trading at an EV/EBIT of 8.0x based on our 2024e and an EV/EBITDA of 3.5x. Compared to its peers, median EBIT multiples for 2024e, Physitrack trades at a 60% discount.
Key financials
| SEKm | 2021 | 2022 | 2023e | 2024e | 2025e |
| Revenues | 8.0 | 12.5 | 15.7 | 19.6 | 23.6 |
| Revenue Growth | 162% | 56.6% | 25.6% | 24.8% | 20.3% |
| EBITDA | 0.89 | 2.5 | 3.9 | 6.4 | 8.7 |
| EBIT | -0.58 | 0.11 | 0.55 | 2.8 | 4.2 |
| EBIT Margin | -7.3% | 0.9% | 3.5% | 14.3% | 18.0% |
| Net Income | -0.84 | 0.09 | 1.00 | 2.4 | 4.0 |
| EV/Revenue | -1.7 | 2.8 | 1.6 | 1.1 | 0.8 |
| EV/EBIT | 22.8 | 34.9 | 45.5 | 8.0 | 4.3 |
| EV/EBITDA | -15.0 | 10.2 | 6.3 | 3.5 | 2.1 |
Case
Strong growth, rising recurring revenues with approaching margin expansion
Evidence
Adopting a low-cost, tried-and-trusted growth strategy for Wellness
Challenge
Profitable growth
Challenge
Consolidation of Wellness
Valuation
Significant upside potential with two business divisions priced as one
Q2 Review
In summary, we believe Physitrack´s Q2 2023 showed stable performance. We find the organic growth of 25%, combined with effective cost management in the face of ongoing challenging market conditions, particularly encouraging. The management’s efforts towards enhancing operational efficiency have yielded positive outcomes, stabilising the cost base compared to the previous quarter. Topline growth was less aggressive than the previous quarter but aligned with our expectations. We note that this quarter’s comparables were challenging for the Lifecare division, but the upcoming Q3 and Q4 comparables are softer.
| Physitrack: Forecast deviations | |||||||||
| (EURm) | 2022Q1 | 2022Q2 | 2022Q3 | 2022Q4 | 2023Q1 | 2023Q2 | 2023Q2e | Diff absolute | Diff (%) |
| Revenues | 2.6 | 3.1 | 3.4 | 3.5 | 3.7 | 3.8 | 3.8 | -0.1 | -2% |
| Lifecare | 2.0 | 2.4 | 2.2 | 2.2 | 2.4 | 2.4 | 2.4 | -0.1 | |
| Wellness | 0.5 | 0.7 | 1.2 | 1.3 | 1.4 | 1.4 | 1.4 | 0.0 | |
| Operating Expenses | 2.3 | 2.8 | 2.7 | 2.2 | 3.0 | 3.0 | 3.0 | 0.1 | 2% |
| EBITDA | 0.3 | 0.3 | 0.7 | 1.3 | 0.7 | 0.7 | 0.9 | -0.1 | |
| adj.EBITDA | 0.7 | 0.9 | 0.9 | 0.9 | 0.9 | 1.0 | 1.0 | -0.1 | -7% |
| D&A | 0.3 | 0.6 | 0.7 | 0.8 | 0.8 | 0.9 | 0.8 | 0.1 | 7% |
| EBIT | -0.1 | -0.3 | 0.0 | 0.5 | -0.1 | -0.2 | 0.0 | -0.2 | |
| adj.EBIT | 0.4 | 0.3 | 0.2 | 0.1 | 0.1 | 0.1 | 0.2 | -0.1 | |
| Net Income | -0.1 | -0.4 | 0.0 | 0.6 | -0.1 | -0.3 | 0.0 | -0.2 | |
| Growth | |||||||||
| Revenue growth y/y (%) | 67% | 57% | 72% | 38% | 45% | 23% | 25% | -2pp | |
| Lifecare y/y (%) | 0% | 0% | 0% | 0% | 15% | -2% | 2% | -4pp | |
| Wellness y/y (%) | 0% | 0% | 0% | 0% | 160% | 113% | 110% | 3pp | |
| Margins | |||||||||
| EBITDA margin (%) | 10% | 9% | 21% | 37% | 20% | 19% | 22% | -3pp | |
| adj.EBITDA margin (%) | 29% | 30% | 27% | 25% | 25% | 25% | 27% | -2pp | |
| EBIT margin (%) | -2% | -10% | 0% | 14% | -2% | -5% | 0% | -5pp | |
| adj.EBIT margin (%) | 17% | 11% | 6% | 2% | 3% | 1% | 5% | -4pp |
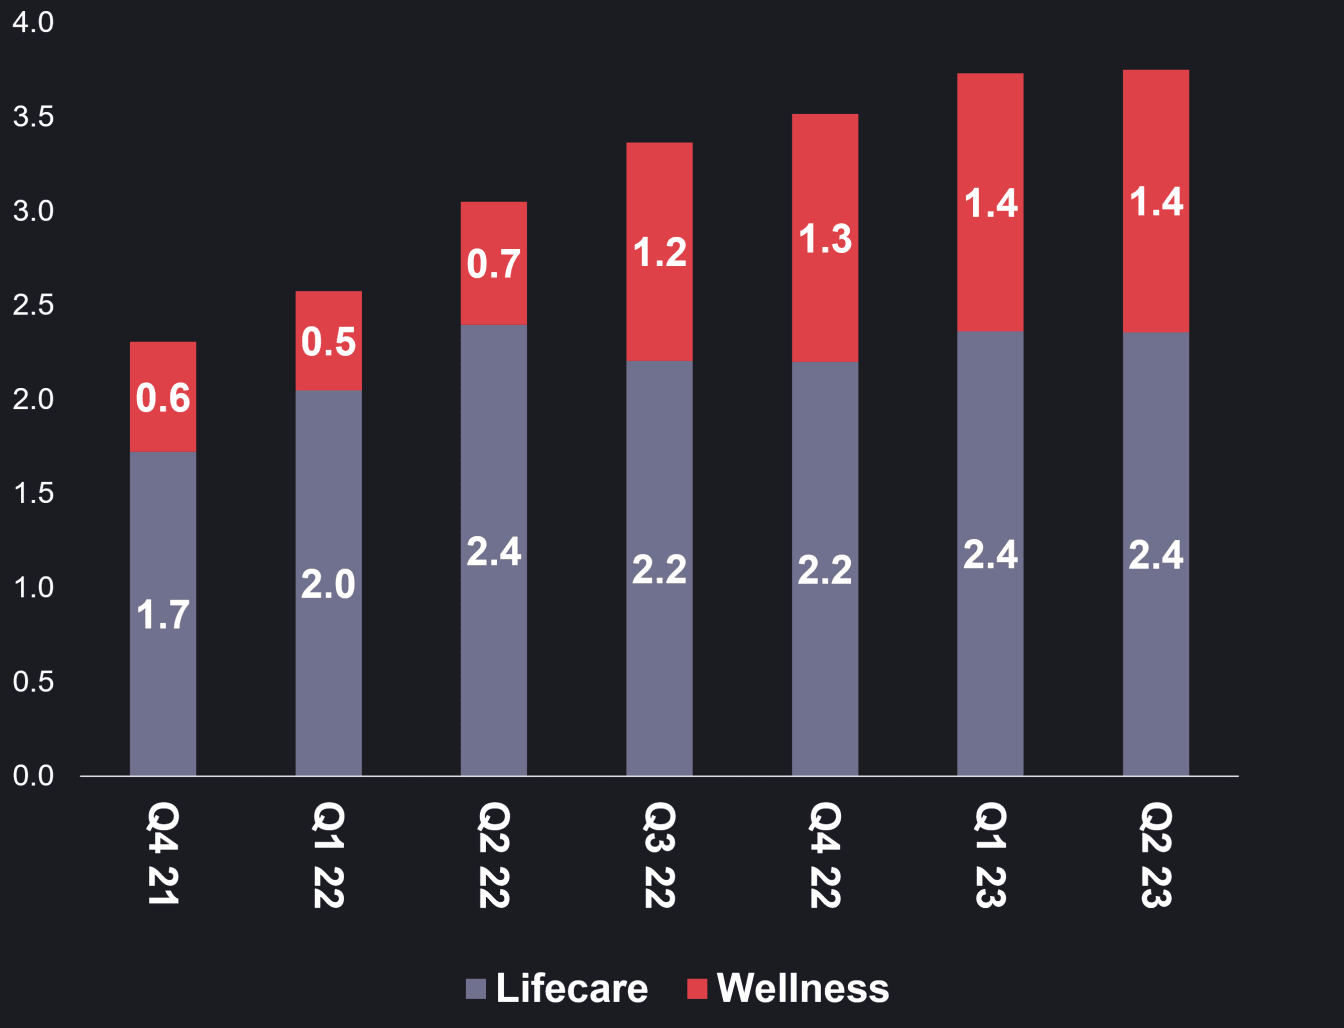
Financial Q2 2023: Revenues
Q2 2023 revenues came in at EUR3.8m (EUR3.0m), in line with our estimate. Lifecare revenues amounted to EUR2.4m (2.4m), on par with our estimate. Wellness revenues amounted to EUR1.4m (EUR0.7m), in line with our estimate. Net sales growth in Q2 2023 equalled c23% y/y, c2pp below our estimate of c25%. Organic growth was, however, 25% y/y.
Looking at revenue generation per segment, Lifecare subscription remains the main contributor, generating c52% of the revenues. Wellness one-off is still larger than Wellness subscription, representing 21% and 16% of the revenues, respectively. In our view, the growth of Wellness subscriptions is one of the most important KPIs for investors to monitor, as it is set to fuel growth as we advance.
Revenue by division
Revenue mix
Source: Redeye Research

Source: Redeye Research
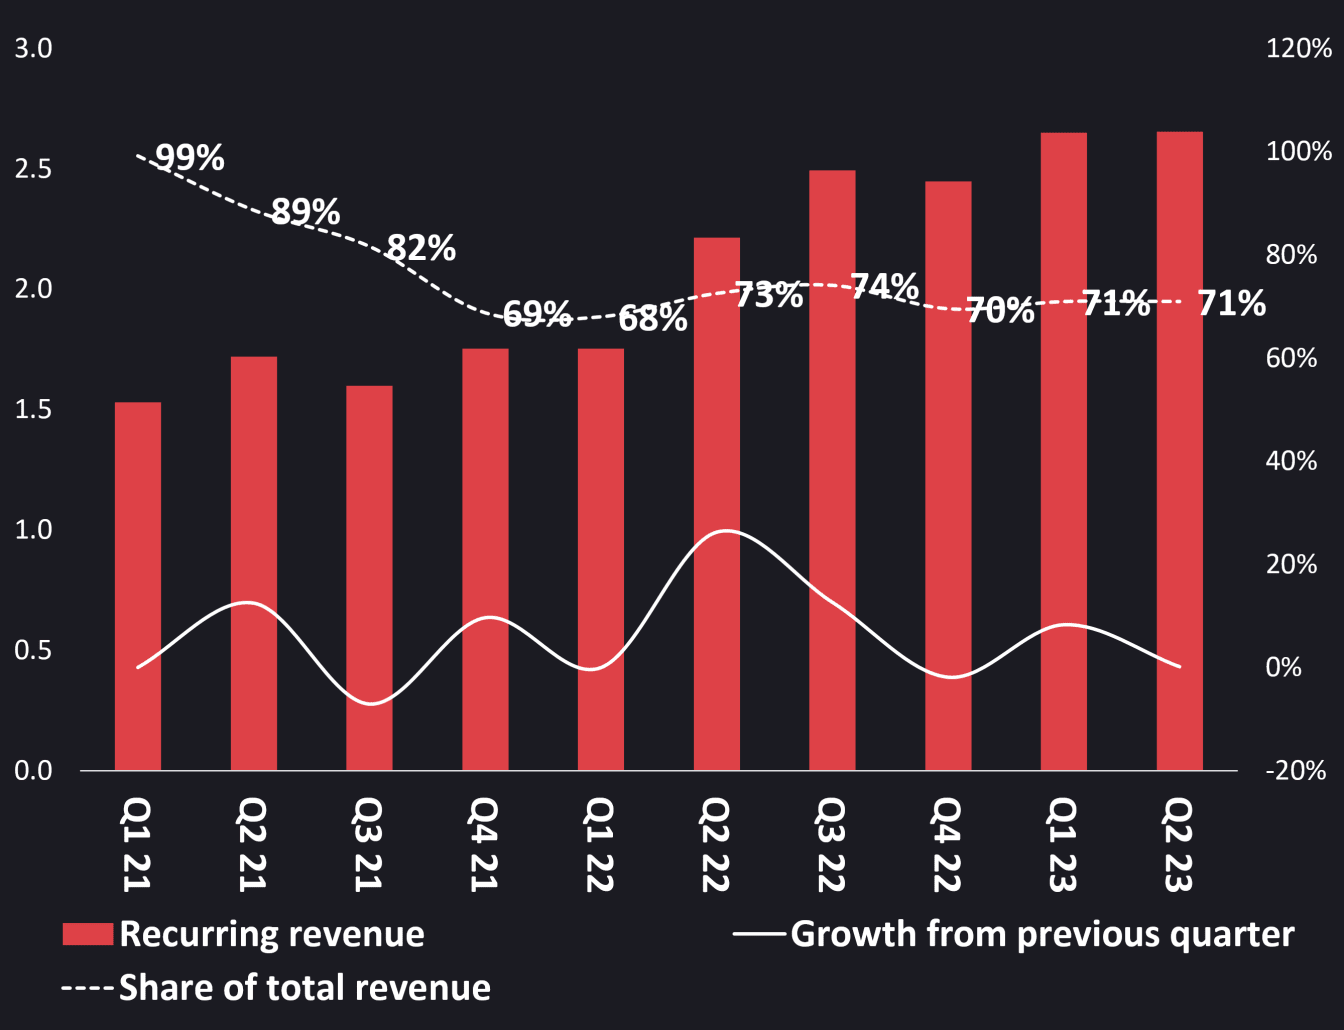
Recurring revenues grew c20% y/y, representing 71% of total revenues. On a q/q basis, recurring revenues were unchanged. We believe the lack of q/q growth is more of a timing issue, as tenders sent out before summer often are attended to after the summer. As such, we expect growth to take off again in Q3.
ARR grew by 17% y/y and 2% q/q. The ARR in Q2’23 was EUR11.5m vs EUR9.8m in Q2’22. We believe the solid y/y growth of the ARR underpins a strong business momentum. We also believe that the swift y/y ramp-up of recurring revenues/ARR, implies that the Wellness division is on the harmonisation and standardisation path. The Lifecare division had 87% recurring revenues in Q2, and Wellness reported 43%.
Recurring revenue
Annual recurring revenue (ARR)
Source: Redeye Research

Source: Redeye Research
Financial Qx 2023: Profitability and Cost base
OPEX, excluding D&A and adjustments, was SEK2.8.m, in line with our estimates. The management’s efforts towards enhancing operational efficiency have yielded positive outcomes, stabilising the cost base compared to the previous quarter. We expect the cost base to continue to hover around EUR2.8m due to management’s counited focus on operational efficiency and profitability.
Adjusted EBITDA reached 25% in the quarter, the same as in Q1’23 and Q4’22 and 2pp below our estimate. During an interview, Henric Molin, the CEO, mentioned that in Q2’23, the margin could likely be enhanced. However, the management decided to forgo this option as it could potentially hinder the company’s growth trajectory. Physitrack’s adjusted EBIT was 1% (11%) in Q2 2023, 4pp below our estimate. D&A amounted to EUR0.8 (EUR0.6).
Revenues, Adjusted EBITDA and Adjusted EBITDA-margin
Source: Redeye Research
Financial Qx 2023: Cash flows and Cash position
After adjusting items, cash flow from operating activities was EUR0.3m (EUR0.1m). Physitrack uses capitalisation – i.e., it records an asset (in this case, development costs) on the balance sheet instead of immediately expensing this on the income statement. In Q2, we estimate that Physitrack capitalised EUR0.8m for development, implying that EBITDA minus capitalisation amounted to EUR0.2m.
By the end of Q2’23, Physitrack held a EUR0.7m cash position, but the available liquidity, including the Revolving Credit Facility (RCF) corresponds to EUR2.8m. Deferred consideration (non-current) was cEUR9m vs EUR10.7m in Q1, and capex continues to linger around EUR0.8m. Management “re-confirms that there is expected to be no further deferred contingent consideration payments for the remainder of the financial year, and no capital raising via share issuance or debt”. Further, management is confident that the business will be FCF positive by the end of the year. Free cash flow is defined by Physitrack as net cash from operating activities, less purchase of intangible assets and property, plant and equipment and finance costs.
We expect Physitrack’s cash position combined with the RCF to be enough to reach positive cash flows and the RCF and FCF to cover further earn-outs. Nevertheless, our estimates allow for a little margin of error. By the end of the quarter, Physitracks’s net debt was cEUR3.0m.
Cashflow and Cash position
Other highlights from the report
We find it favourable that beginning this quarter, Physitrack has introduced an additional growthmetric, namely organic growth. Organic revenue entails the translation of the current year's revenue into the group's presentation currency (Euro) using exchange rates from the previous year. Considering Physitrack's exposure to fluctuations in foreign exchange rates, this metric offers investors a comparable measure for evaluating pro-forma revenue from the prior year.
Outlook
Management emphasises their commitment to delivering profitable growth, indicating that they have and will continue to decline customers if they don’t meet the margin threshold. Moreover, there is a positive outlook for the strong start of Q3, especially within the enterprise customer segment of Champion Health. Physitrack appears adept at navigating the current challenging market conditions, and management expresses confidence in the ongoing resilience stemming from business diversification.
Champion Health Nordic (formerly Fysiotest) has effectively executed a turnaround, and management holds high expectations for growth and profitability. Additionally, there are no signs of growth stagnation within the Wellness division. During the Q2’23 webcast conference, we learned that the US market is the next launch market for Champion Health’s digital product aimed at SME (Small and Medium Enterprises) customers. Presently, active marketing campaigns for this product are limited to the UK, and management seems content with the progress of the launch.
The report reaffirmed the financial midterm targets, which encompass a 30% year-on-year organic growth coupled with EBITDA margins ranging from 40% to 45%. Furthermore, management is confident in achieving positive Free Cash Flow (FCF) by year-end.
Estimate revisions
We have made minor adjustments to our near-term estimates following Physitrack’s Q2 report:
- We decrease our sales forecasts by -1% for 2023e–2024e implying 27% (26%) and 25% (25%) y/y growth, respectively.
- Furthermore, we have decreased our OPEX assumptions slightly for 2024e. We believe that the cost base expansion seen in previous quarters has plateaued, and it is supported by management’s statement on operational efficacy focus in combination with margin prioritisation.
Relative to Physitrack's midterm-term targets of 40-45% EBITDA margin and 30% organic growth, we have adopted a more conservative stance regarding growth and margins in the midterm perspective. For further estimates, see the tables below.
| Estimate revisions | ||||||||||||
| (EURm) | New estimates | Old estimates | Difference % | |||||||||
| 2023E | 2024E | 2025E | 2023E | 2024E | 2025E | 2023E | 2024E | 2025E | ||||
| Revenues | 16 | 20 | 24 | 16 | 20 | 24 | -1% | -1% | -1% | |||
| Wellness | 6 | 13 | 15 | 6 | 14 | 15 | -1% | -2% | -1% | |||
| Lifecare | 10 | 11 | 12 | 10 | 11 | 12 | -1% | -1% | -1% | |||
| Revenue growth y/y | 26% | 25% | 20% | 27% | 25% | 20% | 1pp | 0pp | 0pp | |||
| Operating Expenses | 12 | 13 | 15 | 12 | 14 | 15 | 0% | -2% | -1% | |||
| D&A | 3 | 4 | 4 | 3 | 4 | 4 | 3% | 0% | 4% | |||
| Total Operating Expenses | 15 | 17 | 19 | 15 | 17 | 19 | 1% | -2% | 0% | |||
| adj.EBITDA | 5 | 6 | 9 | 4 | 6 | 9 | 2% | 2% | -1% | |||
| adj.EBITDA margin (%) | 29% | 33% | 37% | 28% | 32% | 37% | -1pp | -1pp | 0pp | |||
| EBIT | 1 | 3 | 4 | 1 | 3 | 5 | -31% | 4% | -6% | |||
| EBIT margin | 3% | 14% | 18% | 5% | 14% | 19% | 2pp | -1pp | 1pp | |||
| Net income | 0.999 | 2 | 4 | 0.623 | 2 | 4 | 60% | 5% | -6% |
Estimates
| Physitrack: Estimate | ||||||||||
| (EURm) | 2022 | 2023Q1 | 2023Q2 | 2023Q3 | 2023Q4 | 2023 | 2024 | 2025 | 2026 | 2027 |
| Revenues | 12.5 | 3.7 | 3.8 | 4.0 | 4.2 | 15.7 | 19.6 | 23.6 | 27.8 | 32.7 |
| Lifecare | 8.6 | 2.4 | 2.4 | 2.4 | 2.4 | 9.5 | 10.5 | 11.8 | 13.1 | 14.6 |
| Wellness | 3.9 | 1.4 | 1.4 | 1.6 | 1.8 | 6.2 | 9.1 | 11.8 | 14.7 | 18.1 |
| Operating Expenses | 10.0 | 3.0 | 3.0 | 2.7 | 2.8 | 11.8 | 13.2 | 14.9 | 16.7 | 19.3 |
| EBITDA | 2.5 | 0.7 | 0.7 | 1.3 | 1.4 | 3.9 | 6.4 | 8.7 | 11.1 | 13.4 |
| adj.EBITDA | 3.4 | 0.9 | 1.0 | 1.3 | 1.4 | 4.6 | 6.4 | 8.7 | 11.1 | 13.4 |
| D&A | 2.4 | 0.8 | 0.9 | 0.9 | 0.8 | 3.4 | 3.6 | 4.5 | 4.7 | 5.6 |
| EBIT | 0.1 | -0.1 | -0.2 | 0.4 | 0.6 | 0.5 | 2.8 | 4.2 | 6.4 | 7.8 |
| adj.EBIT | 1.0 | 0.1 | 0.1 | 0.4 | 0.6 | 1.2 | 2.8 | 4.2 | 6.4 | 7.8 |
| EPS basic | 0.01 | 0.00 | 0.00 | 0.03 | 0.05 | 0.06 | 0.15 | 0.25 | 0.37 | 0.38 |
| Growth | ||||||||||
| Revenue growth y/y (%) | 57% | 45% | 23% | 20% | 19% | 26% | 25% | 20% | 18% | 17% |
| Lifecare y/y (%) | 0% | 15% | 2% | 9% | 10% | 10% | 11% | 12% | 11% | 11% |
| Wellness y/y (%) | 0% | 160% | 110% | 40% | 35% | 60% | 47% | 30% | 25% | 23% |
| Margins | ||||||||||
| EBITDA margin (%) | 20% | 20% | 19% | 32% | 34% | 25% | 33% | 37% | 40% | 41% |
| adj.EBITDA margin (%) | 28% | 25% | 25% | 32% | 34% | 29% | 33% | 37% | 40% | 41% |
| EBIT margin (%) | 1% | -2% | -5% | 10% | 15% | 3% | 14% | 18% | 23% | 24% |
| adj.EBIT margin (%) | 8% | 3% | 1% | 10% | 15% | 8% | 14% | 18% | 23% | 24% |
| Net income margin (%) | 1% | -2% | 0% | 13% | 18% | 6% | 12% | 17% | 22% | 19% |
Valuation
We have increased our fair value range on the back of the estimate revisions and the increase of the EUR/SEK that impacts the valuation positively. Our new base is SEK41 (SEK38) per share, while the bull and bear case stands at SEK80 (SEK72) and SEK12(SEK11), respectively. Our valuation is based on the financial forecasts in the table above (Base case) and long-term assumptions outlined in the table below. We have used a WACC of 12%, derived from Redeye’s Rating model.
| Assumptions, fair value range | ||||
| Bear Case | Base Case | Bull Case | ||
| Value per share, SEK | 12 | 41 | 79 | |
| Sales CAGR 2023e-2027e | 13% | 21% | 30% | |
| EBIT margin (avg) 2023e-2027e | 14% | 17% | 18% | |
| Terminal EBIT margin | 14% | 16% | 18% | |
| WACC | 12% | 12% | 12% | |
| Terminal Growth | 2% | 2% | 2% | |
| Source: Redeye Research |
Peer valuation
Compared to its peers, median EV/Sales multiples for 2023e–2024e, Physitrack trades at a c40%-45% discount. Moreover, the discount is also prominent when comparing median EV/EBIT multiples for 2024e, with Physitrack trading at a 60% discount to its peers. Despite the management’s guidance, we believe the market continues to worry over the size of potential upcoming earn-outs and a capital infusion need.
| SaaS | EV | EV/SALES | EV/EBIT | Sales growth | EBIT margin | ||||||||
| Company | (SEKm) | 23e | 24e | 25e | 23e | 24e | 25e | 23e | 24e | 25e | 23e | 24e | 25e |
| 4C Group | 791 | 2.1 | 1.7 | 1.3 | 20 | 11 | 7 | 14% | 20% | 21% | 10% | 15% | 17% |
| Addnode | 10,806 | 1.5 | 1.3 | 1.2 | 25 | 17 | 14 | 17% | 17% | 12% | 6% | 7% | 8% |
| Admicom | 2,061 | 5.2 | 4.7 | 4.1 | 16 | 14 | 11 | 7% | 7% | 11% | 32% | 33% | 36% |
| AVTECH | 159 | 5.5 | 4.3 | 3.0 | 14 | 10 | 6 | 35% | 15% | 25% | 38% | 41% | 49% |
| Bambuser | 104 | 0.5 | 0.9 | 1.0 | neg | neg | neg | -2% | 4% | 21% | -83% | -61% | -37% |
| BIMobject | 272 | 1.8 | 1.7 | 1.5 | neg | neg | neg | 14% | 17% | 20% | -29% | -17% | -6% |
| BuildData | 196 | 1.8 | 1.6 | n/a | neg | neg | n/a | 23% | 18% | n/a | -21% | -6% | n/a |
| Carasent | 616 | 2.3 | 2.0 | 1.7 | neg | 19 | 10 | 30% | 18% | 17% | -1% | 11% | 17% |
| CheckIn | 995 | 9.7 | 5.1 | 2.6 | 124 | 26 | 11 | 47% | 87% | 81% | 8% | 20% | 24% |
| CSAM | 1,113 | 2.7 | 2.5 | 2.1 | 61 | 19 | 16 | 11% | 13% | 25% | 4% | 14% | 13% |
| Efecte | 687 | 2.3 | 1.9 | 1.6 | neg | 87 | 23 | 15% | 17% | 17% | -5% | 2% | 7% |
| Formpipe | 1,442 | 2.7 | 2.3 | 2.0 | 28 | 15 | 10 | 11% | 10% | 9% | 10% | 16% | 19% |
| Fortnox | 36,958 | 22.4 | 17.2 | 13.5 | 55 | 38 | 28 | 29% | 29% | 25% | 41% | 45% | 48% |
| Hoylu | 123 | 2.2 | 1.6 | n/a | neg | neg | n/a | 34% | 36% | n/a | -102% | -44% | n/a |
| Irisity | 245 | 1.9 | 1.3 | 1.1 | neg | neg | neg | 48% | 38% | 21% | -80% | -34% | -20% |
| Pagero | 2,643 | 3.3 | 2.7 | 2.1 | neg | neg | 41 | 7% | 28% | 28% | -20% | -8% | 5% |
| LeadDesk | 565 | 1.6 | 1.3 | n/a | 265 | 32 | n/a | 7% | 11% | 8% | 1% | 4% | 10% |
| Lemonsoft | 1,559 | 5.0 | 4.3 | 3.9 | 19 | 16 | 15 | 17% | 13% | 7% | 26% | 26% | 27% |
| Lime | 3,488 | 6.1 | 5.2 | 4.5 | 31 | 25 | 20 | 17% | 13% | 13% | 20% | 21% | 22% |
| Litium | 146 | 2.1 | 1.6 | 1.2 | neg | 29 | 17 | 8% | 29% | 26% | -10% | 6% | 7% |
| Mestro | 94 | 2.5 | 1.8 | 1.3 | neg | 51 | 9 | 40% | 33% | 30% | -21% | 4% | 14% |
| Oneflow | 758 | 7.4 | 5.2 | 3.6 | neg | neg | neg | 48% | 57% | 49% | -91% | -46% | -21% |
| Opter | 380 | 4.8 | 3.8 | 3.1 | 20 | 15 | 11 | 21% | 17% | 15% | 24% | 26% | 28% |
| Penneo | 415 | 2.9 | 2.3 | 2.0 | neg | neg | neg | 24% | 28% | 27% | -30% | -17% | -7% |
| Pexip | 1,834 | 1.8 | 1.6 | 1.3 | 110 | 18 | 11 | 13% | 8% | 10% | 2% | 9% | 12% |
| Physitrack | 305 | 1.6 | 1.2 | 0.9 | 26 | 8 | 4 | 37% | 25% | 20% | 6% | 15% | 21% |
| Safeture | 191 | 3.3 | 2.6 | 2.1 | neg | 52 | 15 | 33% | 26% | 25% | -17% | 5% | 14% |
| Sikri | 1,498 | 1.3 | 1.1 | 1.0 | 17 | 11 | 8 | 0% | 9% | 9% | 8% | 10% | 12% |
| SmartCraft | 3,483 | 8.4 | 7.0 | 5.8 | 26 | 20 | 16 | 19% | 15% | 16% | 33% | 35% | 37% |
| Upsales | 635 | 4.4 | 3.8 | 3.2 | 23 | 22 | 18 | 12% | 16% | 21% | 19% | 17% | 17% |
| Vertiseit | 530 | 1.6 | 1.4 | 1.2 | 27 | 11 | 8 | 4% | 12% | 8% | 6% | 12% | 15% |
| Vitec | 23,624 | 8.5 | 7.5 | 6.7 | 38 | 33 | 28 | 40% | 15% | 13% | 22% | 23% | 24% |
| XMReality | 29 | 1.3 | 0.7 | 0.4 | neg | neg | neg | 16% | 73% | 42% | -136% | -61% | -22% |
| Average | 2,992 | 4.0 | 3.2 | 2.7 | 50 | 25 | 15 | 20% | 23% | 21% | -10% | 3% | 12% |
| Median | 635 | 2.6 | 2.2 | 2.0 | 26 | 19 | 13 | 17% | 17% | 20% | 2% | 9% | 14% |
| Source: Redeye, Company reports, FactSet |
Quality Rating
People: 4
Physitrack scores four out of five in this section. Its decentralised business management, combined with solid execution capabilities in the management team, adds to the score. Moreover, we consider CEO Henrik Molin’s visionary attitude towards the business and the deep market insights to be very encouraging. Henrik Molin has significant skin in the game, as he is also the company’s largest shareholder, with a c25% share of the capital. The score is mainly constrained by the company's limited track record as a publicly traded company.
Business: 3
Physitrack scores three out of five in this section. We are encouraged that the majority of Physitrack’s revenues is recurring in nature, combined with the asset-light business model, the expected long runway of organic growth, and the successful track record of its geographical market expansion. Moreover, we favour the long-term tailwinds that support its business and its limited exposure to significant operational risks. The score is mainly held back by the early commercialisation stage in the Wellness division and the market segment dynamics.
Financials: 1
Physitrack scores one out of five in this section. Based on our current estimates, Physitrack is unlikely to require additional funding to support its operations and organic growth investments, which adds to the score. However, Redeye’s financial rating model is determined using historical figures and requires consistent positive earnings. Naturally, this limits the score for Physitrack due to its short history in its current form, with seven subsidiaries and two business divisions. On the bright side, we are more than likely to revisit the rating and expect this score to increase as more historical data builds up.
Financials
| Income statement | ||||
| SEKm | 2021 | 2022 | 2023e | 2024e |
| Revenues | 8.0 | 12.5 | 15.7 | 19.6 |
| Cost of Revenue | 0.00 | 0.00 | 0.00 | 0.00 |
| Operating Expenses | 7.1 | 10.0 | 11.8 | 13.2 |
| EBITDA | 0.89 | 2.5 | 3.9 | 6.4 |
| Depreciation | 0.39 | 0.00 | 0.00 | 0.00 |
| Amortizations | 1.1 | 2.4 | 3.4 | 3.6 |
| EBIT | -0.58 | 0.11 | 0.55 | 2.8 |
| Shares in Associates | 0.00 | 0.00 | 0.00 | 0.00 |
| Interest Expenses | 0.07 | 0.06 | 0.41 | 0.27 |
| Net Financial Items | -0.07 | -0.06 | -0.41 | -0.27 |
| EBT | -0.65 | 0.05 | 0.13 | 2.5 |
| Income Tax Expenses | 0.19 | -0.04 | -0.05 | 0.13 |
| Net Income | -0.84 | 0.09 | 1.00 | 2.4 |
| Balance sheet | ||||
| Assets | ||||
| Non-current assets | ||||
| SEKm | 2021 | 2022 | 2023e | 2024e |
| Property, Plant and Equipment (Net) | 0.05 | 0.10 | 0.10 | 0.10 |
| Goodwill | 14.4 | 27.2 | 27.2 | 27.2 |
| Intangible Assets | 2.6 | 10.3 | 10.2 | 10.8 |
| Right-of-Use Assets | 0.00 | 0.00 | 0.00 | 0.00 |
| Other Non-Current Assets | 0.10 | 0.10 | 0.10 | 0.10 |
| Total Non-Current Assets | 17.2 | 37.7 | 37.7 | 38.2 |
| Current assets | ||||
| SEKm | 2021 | 2022 | 2023e | 2024e |
| Inventories | 0.07 | 0.05 | 0.02 | 0.02 |
| Accounts Receivable | 1.7 | 3.0 | 2.5 | 2.0 |
| Other Current Assets | 0.00 | 0.00 | 0.00 | 0.00 |
| Cash Equivalents | 13.3 | 0.58 | 1.4 | 3.9 |
| Total Current Assets | 15.1 | 3.6 | 3.9 | 5.9 |
| Total Assets | 32.3 | 41.3 | 41.6 | 44.1 |
| Equity and Liabilities | ||||
| Equity | ||||
| SEKm | 2021 | 2022 | 2023e | 2024e |
| Non Controlling Interest | 0.00 | 0.00 | 0.00 | 0.00 |
| Shareholder's Equity | 23.3 | 22.4 | 23.3 | 25.7 |
| Non-current liabilities | ||||
| SEKm | 2021 | 2022 | 2023e | 2024e |
| Long Term Debt | 0.00 | 0.83 | 3.6 | 3.6 |
| Long Term Lease Liabilities | 0.00 | 0.00 | 0.00 | 0.00 |
| Other Long Term Liabilities | 5.4 | 11.1 | 11.1 | 11.1 |
| Total Non-Current Liabilities | 5.4 | 11.9 | 14.7 | 14.7 |
| Current liabilities | ||||
| SEKm | 2021 | 2022 | 2023e | 2024e |
| Short Term Debt | 0.00 | 0.00 | 0.00 | 0.00 |
| Short Term Lease Liabilities | 0.00 | 0.00 | 0.00 | 0.00 |
| Accounts Payable | 1.4 | 2.2 | 1.6 | 1.7 |
| Other Current Liabilities | 2.2 | 4.8 | 2.1 | 2.1 |
| Total Current Liabilities | 3.6 | 7.0 | 3.6 | 3.7 |
| Total Liabilities and Equity | 32.3 | 41.3 | 41.6 | 44.1 |
| Cash flow | ||||
| SEKm | 2021 | 2022 | 2023e | 2024e |
| Operating Cash Flow | 0.71 | 1.5 | 1.5 | 6.6 |
| Investing Cash Flow | -4.9 | -14.8 | -4.9 | -4.1 |
| Financing Cash Flow | 16.1 | 0.80 | 2.7 | 0.00 |
Rating definitions
The team
Disclosures and disclaimers
Contents
Q2 Review
Financial Q2 2023: Revenues
Financial Qx 2023: Profitability and Cost base
Financial Qx 2023: Cash flows and Cash position
Other highlights from the report
Outlook
Estimate revisions
Estimates
Valuation
Quality Rating
Financials
Rating definitions
The team
Download article