Formpipe: Solid Momentum in Public Sector
Research Update
2023-07-17
06:45
Redeye retains its positive view of Formpipe following a Q2 report largely matching our expectations. A strong Public ACV offset a somewhat soft ACV in Private, giving a total ACV slightly higher than expected. Although EBIT was marginally lower than anticipated, Formpipe continues to improve its margins gradually, aligning with its target.
FN
TO
Fredrik Nilsson
Tomas Otterbeck
Contents
Review of Q2 2023
ARR: Strong Momentum in Public DK - Again
Sales: Matching Our Forecast Thanks to a Large License Deal
OPEX: Somewhat Higher than Expected
Profit and Cash Flow: Solid y/y Improvement
New CEO Announced
Estimate Revisions: Minor Overall Changes
Valuation
Investment thesis
Quality Rating
Financials
Rating definitions
The team
Download article
Strong Momentum in DK Continues
As seen in the two most recent quarters, a softer ACV in the Private segment was compensated for by a solid contribution from Public DK following strong sales to both municipalities and Landburgsstyrelsen. While Public Sweden’s net ACV was roughly flat, the underlying development was solid. This is because Formpipe terminated an unprofitable S&M contract with an ACV of SEK3m related to a customer-specific solution. The total ARR (S&M and SaaS) was SEK406m (333m), up from SEK383m in the last quarter, corresponding to an annualised q/q growth of 26%, which of half was driven by FX. The total FX-adjusted ACV was SEK10.9, largely matching our forecast of SEK10.0m and last year’s SEK10.0m.
But Private Remains Somewhat Soft
Private performed slightly weaker than our expectations, mainly due to increased churn in Support & Maintenance contracts related to old on-premises deals. Also, while MSFT Finance and Operations has historically been the most important source of customers, the interest in Lasernet in conjunction with MSFT Business Central (BC) has increased. As Formpipe and its partners now focus on further strengthening the offering to MSFT BC, short-term new sales might take a small hit while the TAM increases. On the other hand, during the quarter, Formpipe received a large banking deal as a traditional license which would have added SEKc1-2m in ACV if received as SaaS instead.
Base Case Unchanged at SEK35
We leave our Base Case at SEK35 (35) following a Q2 report roughly in line with our expectations. Although the EBIT and margin were somewhat below our expectations, Formpipe successfully executes its strategy, where improving margins is the focus. We believe upcoming quarterly reports showing solid ARR growth (ACV) and gradual margin improvements will catalyse the share price to reach our Base Case.
Key financials
| SEKm | 2022 | 2023e | 2024e | 2025e | 2026e |
| Revenues | 485.1 | 537.3 | 589.9 | 642.8 | 693.8 |
| Revenue Growth | 2.5% | 10.8% | 9.8% | 9.0% | 7.9% |
| EBITDA | 72.4 | 119.3 | 159.4 | 189.5 | 216.6 |
| EBIT | 15.8 | 52.0 | 91.4 | 121.2 | 145.5 |
| EBIT Margin | 3.3% | 9.7% | 15.5% | 18.9% | 21.0% |
| Net Income | 8.8 | 39.9 | 71.1 | 94.7 | 113.9 |
| EV/Revenue | 2.5 | 2.7 | 2.3 | 1.9 | 1.6 |
| EV/EBIT | 77.9 | 27.5 | 14.8 | 10.3 | 7.8 |
Review of Q2 2023
| Estmates vs. Actuals | ||||||
| Sales | Q2E 2023 | Q2A 2023 | Diff | Q2A 2022 | Q1A 2023 | |
| Net Sales | 135.0 | 137.0 | 1% | 119.6 | 127.6 | |
| Y/Y Growth (%) | 13% | 15% | 18% | 26% | ||
| Support & Maintenance | 62.4 | 62.3 | 0% | 56.2 | 60.1 | |
| Growth y/y | 11% | 11% | 8% | 15% | ||
| ARR (S&M) | 250.2 | 258.2 | 3% | 227.9 | 249.2 | |
| ACV (S&M) | 1.0 | 2.0 | 100% | 0.2 | 3.3 | |
| SaaS | 32.3 | 32.1 | -1% | 22.2 | 28.1 | |
| Growth y/y | 46% | 45% | 57% | 98% | ||
| ARR (SaaS) | 142.5 | 147.4 | 3% | 104.7 | 133.5 | |
| ACV (SaaS) | 9.0 | 8.9 | -1% | 9.8 | 7.4 | |
| Licenses | 2.3 | 7.9 | 242% | 2.4 | 2.8 | |
| Growth y/y | -5% | 225% | -61% | -55% | ||
| Deliveries | 38.0 | 35.1 | -8% | 38.8 | 36.6 | |
| Growth y/y | -2% | -10% | 34% | 27% | ||
| OPEX | ||||||
| Cost of revenues | -16.9 | -16.3 | -3% | -15.8 | -15.9 | |
| % of sales | -13% | -12% | -13% | -12% | ||
| Other external costs | -28.2 | -30.5 | 8% | -30.7 | -27.7 | |
| Y/Y Growth (%) | -8% | -1% | 56% | 40% | ||
| Personnel expenses | -73.1 | -75.3 | 3% | -71.5 | -73.4 | |
| Y/Y Growth (%) | 2% | 5% | 13% | 16% | ||
| Earnings | ||||||
| EBIT | 14.0 | 13.0 | -7% | 0.4 | 7.1 | |
| EBIT Margin (%) | 10.4% | 9.5% | ||||
| Diluted EPS | 0.20 | 0.09 | -55% | -0.01 | 0.09 |
ARR: Strong Momentum in Public DK - Again
The total ARR (S&M and SaaS) was SEK406m (333m), up from SEK383m in the last quarter, corresponding to an annualised q/q growth of 26%, which of half was driven by FX. The total FX-adjusted ACV was SEK10.9, largely matching our forecast of SEK10.0m and last year’s SEK10.0m. The ACV was boosted by better momentum in Public DK than expected, following strong sales to both municipalities and Landburgsstyrelsen, as seen in the last quarter as well. The underlying ACV in Public SE was also strong, although hurt by a terminated (by Formpipe) unprofitable S&M contract worth SEK3m in ACV related to a customer-specific solution.
Private performed slightly weaker than our expectations, mainly due to increased churn in Support & Maintenance contracts related to old on-premises deals. However, as time passes unless going bankrupt, those customers will have to renew their plans or, more likely, move to SaaS – given that they continue to use the software. Also, while MSFT Finance and Operations has historically been the most important source of customers, the interest in Lasernet in conjunction with MSFT Business Central (BC) has increased. As Formpipe and its partners now focus on further strengthening the offering to MSFT BC, short-term new sales might take a hit while the TAM increases.

Source: Formpipe

Source: Formpipe
The ARR, both S&M and SaaS, and its growth rate (ACV) is the most important metric to follow in Formpipe. The ARR is a leading indicator of recurring revenue growth, the major driver of profit growth in Formpipe and essential to the investment case.
Sales: Matching Our Forecast Thanks to a Large License Deal
Total sales beat our forecast of SEK135m and amounted to SEK137m (120), corresponding to 15% growth y/y. As expected, the y/y growth was mainly driven by S&M and SaaS, following the strong ARR growth (ACV) during 2022 and early 2023. Recurring revenue, S&M and SaaS, grew by 21% y/y, which matched our expectations.
The sales mix contained lower Deliveries but higher Licenses compared to our expectations. Formpipe had a large on-premise deal with a banking customer during the quarter, boosting License sales. Total Deliveries declined y/y by 10%. Deliveries in Public DK increased somewhat y/y to SEK20m. The improvement aligns with the level seen in Q1 2023 and with management’s guidance, as H2 2022 was negatively affected by a major product release. Deliveries in Private are coming down as Formpipe wants partners to take care of the delivery in the Private segment, and, thus, that is nothing we are worried about, although it declined somewhat faster than we expected. Regarding Sweden, Deliveries were down 7% y/y while we estimated some growth. Altough Q2 2023 was negatively affected by calendar effects, management prioritises efficiency over growth in Deliveries SE at this point.

Source: Formpipe
Formpipe has four kinds of sales: Support & Maintenance (S&M), SaaS, Licenses and Deliveries. Support & Maintenance relates to service agreements for software sold as an on-premises license and SaaS add-on modules where the platform was initially sold as an on-premises license. The Support & Maintenance revenue is 100% recurring and largely resembles SaaS revenue with high gross margins. SaaS revenue is 100% recurring software revenue from software sold as a subscription with high gross margins. Licenses constitute on-premises licenses, and their share of total sales is low and declining. Deliveries is revenue from consulting or professional service with lower gross margins, where Formpipe integrates and sometimes customizes the software.
OPEX: Somewhat Higher than Expected
Overall, OPEX came in above our forecast of SEK188m and was SEK121m (118). Sales expenses roughly matched our forecast, while Other external costs were slightly higher. Personnel expenses came in above our forecasts as the cost per employee was higher than we expected. On the other hand, the number of employees by the quarter’s end was lower than we assumed. According to management, the net reduction of nine employees q/q is mainly related to group-level support functions, which the more decentralised Formpipe (into its segments) no longer needs the same amount of.

Source: Formpipe
Sales expenses relate mainly to partner kickbacks and sub-consultants. In addition to the typical Other costs, like rent, software and travel, the line includes Formpipe’s Ukrainian-based offshore resources.
Profit and Cash Flow: Solid y/y Improvement
EBIT was SEK13m (0.4), corresponding to an EBIT margin of 9.5% (10.4). Our forecast was SEK14.0m and 10.4%, and the slight miss was mainly due to higher OPEX, while the strong License sales we did not expect compensated for the majority of the higher OPEX. Nevertheless, Formpipe executes its plan of continuing growth while keeping costs roughly flat, gradually improving margins.
EBITDA - CAPEX was SEK15.3m (1.6), corresponding to an EBITDA - CAPEX margin of 8.4% (1.3), beating our forecast of SEK16.8m. While we believe EBITDA - CAPEX is a better proxy for the underlying profitability than EBIT, Formpipe does not disclose its quarterly leasing payments, so we exclude it from the CAPEX. However, in general, we typically include leasing payments in the CAPEX.
By the end of the quarter, Formpipe’s net debt was SEK41m, equal to 0.3 EBITDA 2023e.

Source: Formpipe
As for any SaaS business capitalizing R&D, EBITDA and EBITDA margin are unsuitable metrics for Formpipe. This, as EBITDA discards a large portion of the company’s R&D costs totally. R&D is typically a high cost for most SaaS businesses. Instead, EBIT (where the capitalized R&D is amortized over time) or EBITDA – capitalized R&D/EBITDA – capex are better measures of the underlying profitability as it concerns the company’s full R&D spend.
New CEO Announced
Magnus Svenningson will become the new CEO Formpipe starting from 1 August 2023. Svenningson has been the CEO of the cyber security company Primekey Solutions AB from 2016 until it was acquired by Insight Partners’ portfolio company Keyfactor in 2022. Following the acquisition, Magnus transitioned to the role of Chief Strategy Officer at Keyfactor, where he led the integration of the two global organisations. Additionally, since 2022, he has been a board member of Verisec International, an IT security company. Before his time at Primekey Solutions AB, Magnus held notable leadership positions in technology companies, such as CEO of Speed Identity AB, as well as sales roles within Ericsson and Hewlett Packard.
Svenningson has vast experience in international sales of software as well as working towards both the private and public sectors. Our first impression is that Svenningson seems to fit the needs of Formpipe well, considering his experiences.
Estimate Revisions: Minor Overall Changes
While adjusting the sales mix somewhat with more recurring revenue and fewer Deliveries, we leave our total sales forecast for 2023 and 2024 roughly unchanged. We lower EBIT for 2023 marginally, mainly due to the slightly lower outcome in this quarter. For 2024, we raise our EBIT forecast by 4%.
We keep our ACV forecasts roughly unchanged. While we do not expect the very strong momentum in DK to continue, we believe a rebound in Private ACV will compensate.
Notable changes:
- We lower our expectations on Deliveries somewhat. It is just fine in Private, as Formpipe has successfully activated partners and sub-consultants. However, for Public Sweden, the growth ambitions seem, at least for now, to be slightly lower than we have assumed. On the other hand, the strong boost from FX in ACV results in raised ARR and recurring revenue (S&M and SaaS) forecast.
- Despite the higher personnel expenses in the quarter than expected, considering the net reduction of nine employees, we somewhat lowered our personnel expenses forecast.
| Estimate Revisions | ||||||
| Sales | FYE 2023 | Old | Change | FYE 2024 | Old | Change |
| Net Sales | 537.3 | 535.0 | 0% | 589.9 | 586.7 | 1% |
| Y/Y Growth (%) | 11% | 10% | 10% | 10% | ||
| Support & Maintenance | 252.2 | 248.3 | 2% | 264.2 | 256.2 | 3% |
| Growth y/y | 11% | 10% | 5% | 3% | ||
| ARR (S&M) | 261.2 | 253.2 | 3% | 267.2 | 259.2 | 3% |
| ACV (S&M) | 8.3 | 7.3 | 14% | 6.0 | 6.0 | 0% |
| SaaS | 133.2 | 131.6 | 1% | 173.4 | 168.5 | 3% |
| Growth y/y | 42% | 40% | 30% | 28% | ||
| ARR (SaaS) | 164.4 | 159.5 | 3% | 200.4 | 195.5 | 3% |
| ACV (SaaS) | 33.3 | 33.4 | 0% | 36.0 | 36.0 | 0% |
| Licenses | 18.9 | 13.3 | 42% | 13.9 | 13.0 | 7% |
| Growth y/y | 14% | -20% | -26% | -2% | ||
| Deliveries | 133.0 | 141.9 | -6% | 138.3 | 149.0 | -7% |
| Growth y/y | -10% | -4% | 4% | 5% | ||
| OPEX | ||||||
| Cost of revenues | -65.7 | -66.3 | -1% | -70.8 | -70.4 | 1% |
| % of sales | 12% | 12% | 12% | 12% | ||
| Other external costs | -115.6 | -113.3 | 2% | -117.9 | -115.6 | 2% |
| Y/Y Growth (%) | -1% | -3% | 2% | 2% | ||
| Personnel expenses | -288.2 | -290.3 | -1% | -294.8 | -304.2 | -3% |
| Y/Y Growth (%) | 2% | 3% | 2% | 5% | ||
| Earnings | ||||||
| EBIT | 52.0 | 52.7 | -1% | 91.4 | 87.5 | 4% |
| EBIT Margin (%) | 9.7% | 9.9% | 15.5% | 14.9% | ||
| Diluted EPS | 0.74 | 0.76 | -4% | 1.31 | 1.25 | 4% |
| Forecasts | ||||||||
| Sales | Q1A 2023 | Q2A 2023 | Q3E 2023 | Q4E 2023 | FYE 2023 | FYE 2024 | FYE 2025 | FYE 2026 |
| Net Sales | 127.6 | 137.5 | 131.1 | 141.1 | 537.3 | 589.9 | 642.8 | 693.8 |
| Y/Y Growth (%) | 6% | 15% | 12% | 10% | 11% | 10% | 9% | 8% |
| Support & Maintenance | 60.1 | 62.3 | 64.7 | 65.1 | 252.2 | 264.2 | 270.2 | 276.2 |
| Growth y/y | 8% | 11% | 15% | 12% | 11% | 5% | 2% | 2% |
| ARR (S&M) | 249.2 | 258.2 | 259.2 | 261.2 | 261.2 | 267.2 | 273.2 | 279.2 |
| ACV (S&M) | 3.3 | 2.0 | 1.0 | 2.0 | 8.3 | 6.0 | 6.0 | 6.0 |
| SaaS | 28.1 | 32.1 | 35.1 | 37.9 | 133.2 | 173.4 | 213.7 | 251.7 |
| Growth y/y | 35% | 45% | 43% | 44% | 42% | 30% | 23% | 18% |
| ARR (SaaS) | 133.5 | 147.4 | 155.4 | 164.4 | 164.4 | 200.4 | 238.4 | 276.4 |
| ACV (SaaS) | 7.4 | 8.9 | 8.0 | 9.0 | 33.3 | 36.0 | 38.0 | 38.0 |
| Licenses | 2.8 | 7.9 | 3.3 | 4.9 | 18.9 | 13.9 | 13.7 | 13.4 |
| Growth y/y | -23% | 225% | -5% | -30% | 14% | -26% | -2% | -2% |
| Deliveries | 36.6 | 35.1 | 28.1 | 33.3 | 133.0 | 138.3 | 145.3 | 152.5 |
| Growth y/y | -9% | -10% | -15% | -8% | -10% | 4% | 5% | 5% |
| OPEX | ||||||||
| Cost of revenues | -15.9 | -16.3 | -16.1 | -17.4 | -65.7 | -70.8 | -77.1 | -83.3 |
| % of sales | -12% | -12% | -12% | -12% | -12% | -12% | -12% | -12% |
| Other external costs | -27.7 | -30.5 | -27.8 | -29.7 | -115.6 | -117.9 | -122.7 | -127.1 |
| Y/Y Growth (%) | 2% | -1% | -1% | -5% | -1% | 2% | 4% | 4% |
| Personnel expenses | -73.4 | -75.3 | -66.6 | -73.0 | -288.2 | -294.8 | -309.2 | -325.5 |
| Y/Y Growth (%) | 2% | 5% | 2% | -1% | 2% | 2% | 5% | 5% |
| Earnings | ||||||||
| EBITDA ex CAPEX | 10.7 | 15.3 | 20.6 | 21.1 | 67.8 | 106.4 | 133.8 | 158.1 |
| EBITDA ex CAPEX Margin | 8.4% | 11.2% | 15.7% | 15.0% | 12.6% | 18.0% | 20.8% | 22.8% |
| EBIT | 7.1 | 12.9 | 15.1 | 17.1 | 52.0 | 91.4 | 121.2 | 145.5 |
| EBIT Margin (%) | 5.5% | 9.4% | 11.6% | 12.1% | 9.7% | 15.5% | 18.9% | 21.0% |
| Diluted EPS | 0.09 | 0.09 | 0.21 | 0.24 | 0.74 | 1.31 | 1.75 | 2.10 |
Valuation
We leave our Base Case at SEK35 (35) following a Q2 report roughly in line with our expectations. ACV remains healthy, and the expected margin expansion took another step forward in the quarter. We believe strong growth in recurring revenue fueled by strong ACV in 2022 and continuing momentum in ACV during 2023, along with margin expansion, will provide solid profit growth over the next few years.
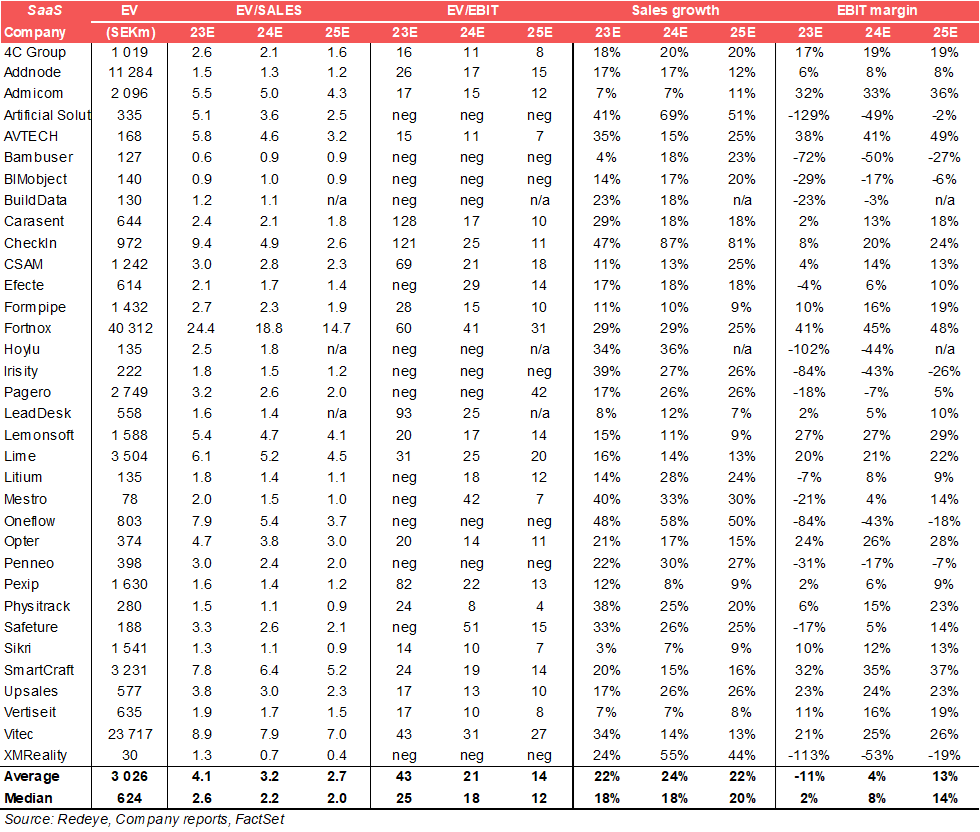
Peer Valuation
While Formpipe does not look very attractive on EV/EBIT multiples 2023, as Formpipe focuses on growth, investors should focus on EV/Sales. We believe the combination of a rather low EV/sales, decent sales growth potential, and solid margin expansion potential make Formpipe interesting. The 2025 EV/EBIT of 10x hints at where the expected margin improvement and decent sales growth make with the EV/EBIT valuation. Also, considering that we believe Formpipe can reach an EBIT margin of almost 20% (18.9) in 2025, the 2023e EV/S of 2.7x is arguably attractive given the company reaches our forecasts or its 20% EBIT margin target.

Investment thesis
Case
Margins to Increase as Private Sector Initiatives Pays Off
Evidence
Substantial Improvements in SaaS Growth Suggest Efficient Investments
Challenge
Limited Growth Compared to Average SaaS Business
Challenge
Diversification or Diworsification?
Valuation
Fair Value SEK 35
Quality Rating
People: 4
Formpipe Software's CEO Christian Sundin has a long experience from the IT sector, has worked with Formpipe since 2006 and is knowledgeable about the market. The acquisition of Traen in 2012 was followed by several years of weak performance. However, during the last years, management has demonstrated their ability, as Formpipe's cash flows have been stable and growing. CEO Christian Sundin and CFO Joakim Alfredson have relatively high holdings in the firm's stock. The company also has several institutions among its major shareholders.
Business: 4
Formpipe Software's market seems stable with underlying growth. Customers are mainly from the public sector and a big part of revenues are recurring, which creates stability in the business model. Recently, Formpipe has had success with its Lasernet product within the private sector. Unlike the Swedish and Danish public sector, the private sector is global, making the potential much greater.
Financials: 3
Formpipe has non-cyclical recurring revenue streams and a solid financial position. The margins have improved in recent years and are now at robust levels, independent of large License deals. Formpipe is now focusing on growth, and so far, the strategy seems to play out very well.
Financials
| Income statement | |||||
| SEKm | 2022 | 2023e | 2024e | 2025e | 2026e |
| Revenues | 485.1 | 537.3 | 589.9 | 642.8 | 693.8 |
| Cost of Revenue | 67.3 | 65.7 | 70.8 | 77.1 | 83.3 |
| Operating Expenses | 345.4 | 352.3 | 359.7 | 376.2 | 393.9 |
| EBITDA | 72.4 | 119.3 | 159.4 | 189.5 | 216.6 |
| Depreciation | 3.2 | 3.5 | 1.4 | 0.67 | 0.00 |
| Amortizations | 45.6 | 54.4 | 57.1 | 58.2 | 61.8 |
| EBIT | 15.8 | 52.0 | 91.4 | 121.2 | 145.5 |
| Shares in Associates | 0.00 | 0.00 | 0.00 | 0.00 | 0.00 |
| Interest Expenses | -2.2 | -2.2 | -2.0 | -2.0 | -2.0 |
| Net Financial Items | 0.04 | 2.2 | 2.0 | 2.0 | 2.0 |
| EBT | 11.4 | 49.8 | 89.5 | 119.3 | 143.5 |
| Income Tax Expenses | -2.5 | -9.9 | -18.4 | -24.6 | -29.6 |
| Net Income | 8.8 | 39.9 | 71.1 | 94.7 | 113.9 |
| Balance sheet | |||||
| Assets | |||||
| Non-current assets | |||||
| SEKm | 2022 | 2023e | 2024e | 2025e | 2026e |
| Property, Plant and Equipment (Net) | 4.5 | 2.1 | 0.67 | 0.00 | 0.00 |
| Goodwill | 444.6 | 462.3 | 462.3 | 462.3 | 462.3 |
| Intangible Assets | 167.7 | 177.0 | 181.7 | 193.0 | 206.2 |
| Right-of-Use Assets | 14.7 | 12.4 | 12.4 | 12.4 | 12.4 |
| Other Non-Current Assets | 8.1 | 7.8 | 7.8 | 7.8 | 7.8 |
| Total Non-Current Assets | 639.7 | 661.7 | 664.9 | 675.5 | 688.7 |
| Current assets | |||||
| SEKm | 2022 | 2023e | 2024e | 2025e | 2026e |
| Inventories | 0.00 | 0.00 | 0.00 | 0.00 | 0.00 |
| Accounts Receivable | 138.1 | 139.7 | 153.4 | 167.1 | 180.4 |
| Other Current Assets | 0.00 | 0.00 | 0.00 | 0.00 | 0.00 |
| Cash Equivalents | 4.8 | 35.2 | 116.1 | 213.4 | 326.9 |
| Total Current Assets | 142.9 | 174.9 | 269.5 | 380.6 | 507.3 |
| Total Assets | 782.5 | 836.5 | 934.4 | 1,056.1 | 1,196.0 |
| Equity and Liabilities | |||||
| Equity | |||||
| SEKm | 2022 | 2023e | 2024e | 2025e | 2026e |
| Non Controlling Interest | 0.00 | 0.00 | 0.00 | 0.00 | 0.00 |
| Shareholder's Equity | 442.0 | 503.9 | 574.9 | 669.6 | 783.6 |
| Non-current liabilities | |||||
| SEKm | 2022 | 2023e | 2024e | 2025e | 2026e |
| Long Term Debt | 44.2 | 40.8 | 40.8 | 40.8 | 40.8 |
| Long Term Lease Liabilities | 0.00 | 0.00 | 0.00 | 0.00 | 0.00 |
| Other Non-Current Lease Liabilities | 29.4 | 17.9 | 17.9 | 17.9 | 17.9 |
| Total Non-Current Liabilities | 73.6 | 58.7 | 58.7 | 58.7 | 58.7 |
| Current liabilities | |||||
| SEKm | 2022 | 2023e | 2024e | 2025e | 2026e |
| Short Term Debt | 0.00 | 0.00 | 0.00 | 0.00 | 0.00 |
| Short Term Lease Liabilities | 0.00 | 0.00 | 0.00 | 0.00 | 0.00 |
| Accounts Payable | 266.9 | 274.0 | 300.8 | 327.8 | 353.9 |
| Other Current Liabilities | 0.00 | 0.00 | 0.00 | 0.00 | 0.00 |
| Total Current Liabilities | 266.9 | 274.0 | 300.8 | 327.8 | 353.9 |
| Total Liabilities and Equity | 782.5 | 836.6 | 934.4 | 1,056.1 | 1,196.1 |
| Cash flow | |||||
| SEKm | 2022 | 2023e | 2024e | 2025e | 2026e |
| Operating Cash Flow | 80.7 | 84.9 | 152.2 | 176.2 | 197.9 |
| Investing Cash Flow | -92.8 | -56.4 | -61.8 | -69.4 | -74.9 |
| Financing Cash Flow | -6.3 | -4.7 | -9.4 | -9.4 | -9.4 |
Rating definitions
The team
Disclosures and disclaimers
Contents
Review of Q2 2023
ARR: Strong Momentum in Public DK - Again
Sales: Matching Our Forecast Thanks to a Large License Deal
OPEX: Somewhat Higher than Expected
Profit and Cash Flow: Solid y/y Improvement
New CEO Announced
Estimate Revisions: Minor Overall Changes
Valuation
Investment thesis
Quality Rating
Financials
Rating definitions
The team
Download article