Sensys Gatso: Upcoming Earnings Momentum
Research Update
2023-08-18
07:25
Redeye thinks the Q2 report was solid and that Managed Services is continuing its journey with solid growth, good order intake, and with positive regulatory changes in both Florida and California. Redeye assesses that System Sales will increase in the remainder of 2023 and in 2024, while costs will come down, leading to an upcoming earnings momentum. Redeye makes a slight positive adjustment to its estimates and fair value range.
JVK
Jesper Von Koch
Solid Q2 report
Total revenue was SEK133m, +7% y/y, and above our estimates of SEK121m. Higher System sales explains almost the full difference, although TRaaS sales also beat our expectations. EBIT was SEK5.6m, corresponding to an EBIT margin of 4.2% (5.7% last year). This was above our estimates of SEK -5.8m. Higher sales, higher gross margin, and lower OPEX explain the beat.
Good momentum for new TRaaS sales in the US
With five new contracts in Q2 and early Q3, the company's US TRaaS business is gaining momentum. As such, the company's investments in increased sales efforts on this market appears to bear fruit. Management is confident about being on track to reach its aggressive 2025 target of SEK1bn sales of which at least SEK600m TRaaS. The company believes its pipeline of leads in the USA, as well as the positive ongoing regulation flow in the US, are the keys to reaching these targets.
Earnings momentum coming up
Having had a period with no sales from both Sweden and Saudi Arabia, as well as a heightened cost base, the company is now entering a period in which sales growth should accelerate and costs be reduced. H2 2023e will gain sales momentum from Sweden, the Netherlands and Saudi Arabia delivering System sales. This implies a likely earnings momentum that could trigger the share price. New Base Case is SEK125 (120), Bear Case is SEK65 (64), and Bull Case is SEK185 (180),
Key financials
| SEKm | 2021 | 2022 | 2023e | 2024e | 2025e |
| Revenues | 506.8 | 494.7 | 597.9 | 750.1 | 749.6 |
| Revenue Growth | 11.4% | -2.4% | 20.9% | 25.5% | -0.1% |
| EBITDA | 77.9 | 73.7 | 82.7 | 146.9 | 142.0 |
| EBIT | 40.3 | 31.0 | 31.9 | 92.5 | 87.6 |
| EBIT Margin | 7.9% | 6.3% | 5.3% | 12.3% | 11.7% |
| Net Income | 36.2 | 20.2 | 19.5 | 74.4 | 73.5 |
| EV/Revenue | 129 | 132 | 1.5 | 1.1 | 1.1 |
| EV/EBIT | 1,627 | 2,115 | 27.3 | 9.2 | 9.2 |
| P/E | 1,813 | 3,244 | 42.6 | 11.2 | 11.8 |
Investment thesis
Case
Growing recurring revenue with higher margin
Evidence
Potential in expanding its strong position
Challenge
Cost base for two business areas has historically been hard to handle
Valuation
Base Case at SEK125- we think the gap between price and value will be closed during 2024
Review of Q2: Solid beat
Redeye concludes that Q2 was stronger than Redeye expected, with higher-than-expected revenues and lower cost base than expected. Both System sales and TRaaS came in stronger than estimated. The company's financial guidance for 2023 is also reiterated - indicating higher topline and EBITDA than Redeye previously estimated.
| Sensys Gatso: Estimates vs Actuals | |||||
| SEKm | Q2'23A | Q2'23E | Last year | Beat/ Miss | y/y diff |
| Net sales | 133 | 121 | 125 | 10% | 7% |
| - of which System Sales | 46 | 35 | 51 | 31% | -10% |
| - of which Service & Maintenance | 32 | 33 | 29 | -4% | 10% |
| - of which Managed Services | 55 | 53 | 44 | 4% | 24% |
| Gross margin | 42% | 40% | 41% | 4% | 1% |
| OPEX incl. D&A | 50 | 55 | 44 | -8% | 14% |
| EBIT | 5.6 | -5.8 | 7.1 | -197% | -21% |
| EBIT margin | 4.2% | -4.8% | 5.7% |
Top line: Solid development
Managed Services: Continued growth
Managed Services incl. Licenses amounted to SEK55m (+24% y/y) and accounted for 41% of sales in the quarter.
Managed Services: Revenues per quarter, SEKm
Source: Sensys Gatso
We continue to see a bright future for this part, both short and long-term. In the short term, we expect the several new orders (commented on here) to drive growth. Also, Florida recently regulated speed-enforcement solutions, and additionally California is looking to do the same. This is likely to be a major driver for future growth of this segment.
Service & Maintenance: Solid, but below estimates
Sales from Service & Maintenance came in just below estimates, landing at SEK32m, +10% y/y. Service & Maintenance accounted for 24% of sales in the quarter, meaning that TRaaS revenues accounted for 65% of total revenues. This business area continues to accumulate contracts as more systems are delivered, which makes this kind of revenue predictable and stable.
Service & Maintenance: Revenues per quarter, SEKm
Source: Sensys Gatso
Just as for Managed Services, we believe both the short and long-term future look bright. Looking ahead, we see a smaller boost of revenues in 2023 from the large contract from the Netherlands, which we expect to be further boosted from 2024.
System Sales: OK in a muted situation - H2 and 2024 look promising
System Sales continues to be lumpy – as is its nature. Q2 came in at SEK46m, -10% y/y. System sales accounted for 35% of sales in the quarter.
As we continuously state, investors should look at revenues on a rolling-12-months basis, which shows that revenues are developing well. In its nature, this segment has quite lumpy deliveries and timing is depending on requirements from the customers. As such, even Sensys Gatso itself cannot estimate sales on a quarterly basis. Therefore, we strongly urge investors to look at this segment on a rolling-12-months basis. See below:
System Sales: Revenues per quarter, SEKm
System Sales: LTM revenues, SEKm

Source: Sensys Gatso

Source: Sensys Gatso
Looking ahead, the company’s order book is strong. First, there is 25% left of the SEK 275m Saudi Order. The remaining SEK69m is estimated to be delivered in H2 2023. Also, we estimate that the large contract from the Netherlands will contribute with SEK125m in 2023. In Q2, the first small deliveries to the major project to Swedish Trafikverket were initiated. In H2, these are expected to continue, but the main ramp up is expected in 2024.
Also, the recent order of SEK152m to the Middle East could be the same customer as the Saudi one. If not, a potential additional order for this customer can be much larger that the current order of SEK275m. Hence, this could be an important short-term trigger.
Gross margin: Strong
The gross margin was strong in the quarter, landing at 42%, mainly driven by a low share of System Sales. As a reminder, Managed Services have a considerably higher gross margin than System Sales. However, new go-lives in Managed Services impliy a cost for setting up new cameras, which temporarily hurts the gross margin. Thus, we think the gross margin was higher/lower than a 'normalized' level.
Sensys Gatso: Gross margin
Source: Sensys Gatso
Looking ahead, we expect strong y/y growth in Managed Services, which means several upstarts and the costs that come with this. This will likely weigh on the gross margin in Q3. Also, we expect a larger share of sales coming from system sales which has a lower gross margin than the TRaaS business.
However, long-term, we expect the gross margin to increase as the TRaaS business constitutes a larger part of total sales.
Cost base: OPEX incl. D&A at SEK50m
OPEX incl. depreciation and amortization was SEK50m, SEK5m below estimates. It could be that some of the temporarily heightened OPEX from Q1 was instead recognized as CAPEX in Q2. As such, we think it is too early to say whether this was a normalized level or not.
As previously stated, we think it’s important to include Depreciation & Amortization in the cost base because this is basically R&D costs but capitalized. By this, we mean that the company wouldn’t be able to progress in the way it wants to without these investments. Thus, we think it’s good and cautious practice to include it as we look at the cost level.
From this level, which we think is normalized, we expect slight growth throughout the year as Sensys Gatso scales its US offices to grow Managed Services.
Sensys Gatso: OPEX incl. D&A, SEKm
Source: Sensys Gatso
Looking at the above diagram, we note that the cost base has not grown materially over the years, despite the growth in sales.
Profitability: Strong for a quarter with muted System Sales
EBIT margin landed at +4.2% in the quarter, significantly better than our estimated -4.8%. The beat was partly due to higher sales, partly higher gross margin, and partly a lower cost base.
Looking at the below chart, we see that the quarterly EBIT margin is lumpy due to the lumpiness of System Sales. More important is to note the ongoing margin improvement. We believe this will continue as the company grows with an increasing share of TRaaS revenue. With a larger base of high-margin recurring revenues, we think Sensys Gatso will become increasingly attractive to investors.
Sensys Gatso: Profitability
Source: Sensys Gatso
To see the underlying reality of what has happened to the business, we think the following chart is worthwhile. As can be seen below, the margin improvements have come from both a scaling OPEX and an improved gross margin. We think both of these factors will continue going forward, further pushing up the EBIT margin.
Sensys Gatso: Costs as % of revenues
Source: Sensys Gatso
EBIT contribution per business area: Continued muted profitability from Managed Services
In this section, Service & Maintenance is included in System Sales.
Managed Services – LTM 0% EBIT margin, sales efforts temporarily hurting
Revenues for Managed Services are predictable, but profitability is lumpy since installation costs are included in the cost base when a new city enters production mode. Due to the high gross margin (est. 60%), there is a high operating leverage in the business model. Thus, the margin expands when sales increases as a direct consequence of a rather fixed OPEX base.
Sensys Gatso has invested considerably in building up its sales force in the US, which has put significant pressure on the profitability for this segment. We think the investments are correct and are starting to bear fruit. Soon, we believe the sales force will stabilize which will then lead to improved profitability. See below for a quarterly and LTM overview.
Managed Services: Quarterly revenue and margin
Managed Services: LTM revenue and margin

Source: Sensys Gatso
Source: Sensys Gatso
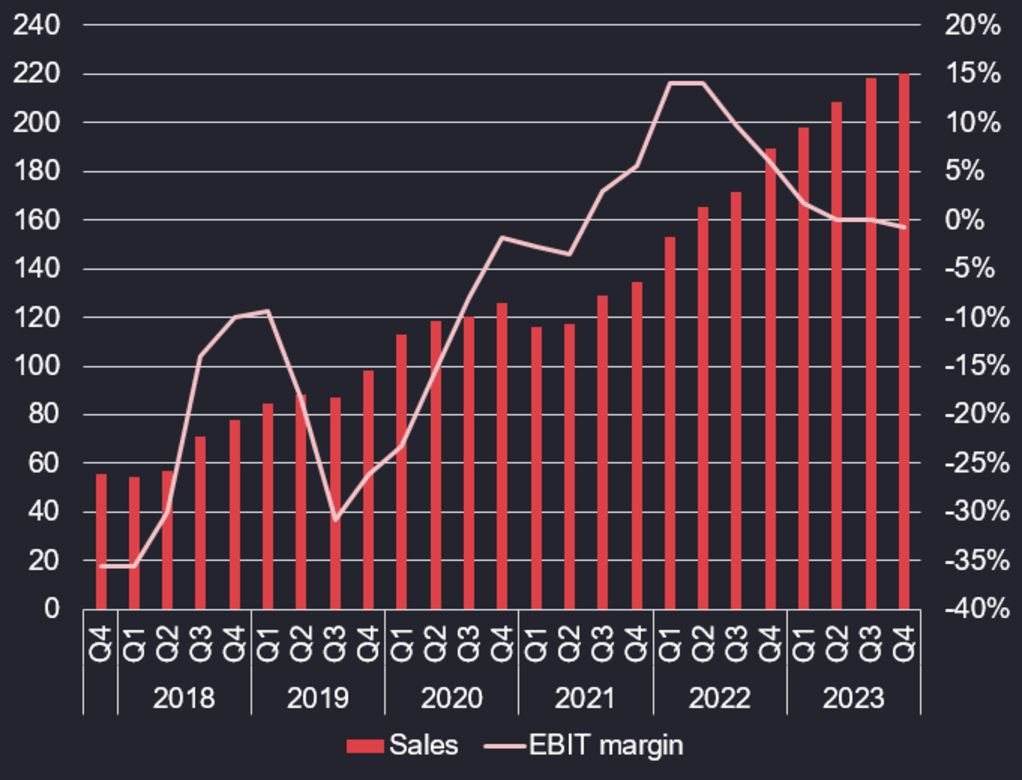
System Sales (inc. Service & Maintenance) – LTM 3.3% EBIT margin – more System Sales needed to ensure sound profitability
Revenues for System Sales, which in these terms include Service & Maintenance, are lumpy. However, the share of Service & Maintenance, which is generally recurring, has increased from 22% in 2018 to almost 50% today. This has contributed to two things: 1) less lumpy revenues and 2) higher profitability. However, a certain volume of System Sales is needed to ensure profitability - something we expect in the following quarters. See below.
System Sales, incl. Service: Q revenue and margin
System Sales: LTM revenue and margin

Source: Sensys Gatso
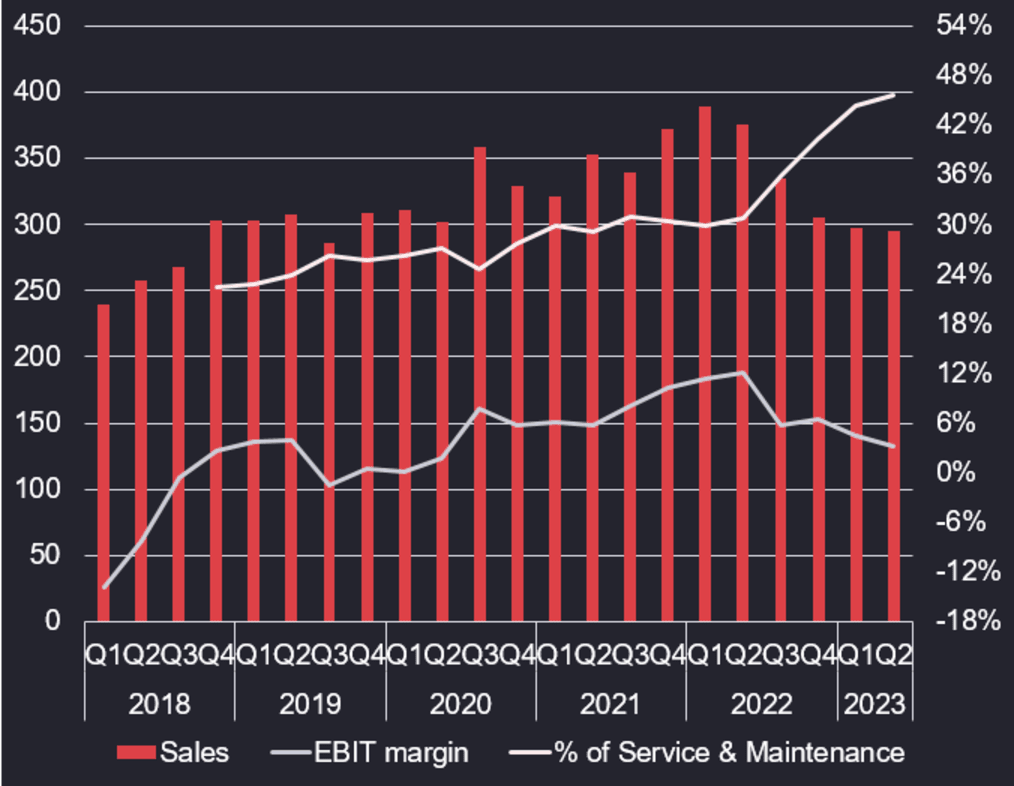
Source: Sensys Gatso
However, the major margin improvement is likely not only due to an increased share of aftermarket revenues. We also believe the company has gained general efficiency improvements over the years.
Solid financial position
By the end of Q2, Sensys Gatso had a strong financial position with SEK54m in cash balance and very little debt. While we think a smaller acquisition may be likely within two years, we do not think it will happen during 2023.
Development in larger contracts
Looking at the company’s large orders, we have the following orders that are noteworthy:
| Overview of major ongoing projects, SEKm | ||||||||||
| Country | Order date | Total value | Value System Sales | Value Serv. & Maint. | Value Man. Serv. | ARR contribution | Revenue start | Contract duration | Possible extension | Comment |
| Saudi | Aug'20 | 275 | 275 | 0 | 0 | 0 | Q3'20 | N/A | N/A | On pause. Last 25% in H2'23 |
| Middle East | Jun'23 | 152 | 152 | 0 | 0 | 0 | H2'23 | 5 years | N/A | SEK16m in 2023, then SEK136m distributed between 2024 and 2027 |
| Netherlands | Mar'22 | 250 | 125 | 125 | 0 | 21 | 2,023 | 6 years | 12 years | System sales starts in Q3'23 |
| Australia | May'22 | 74 | 0 | 0 | 74 | 25 | Q4'22 | 2 years | 1 year | |
| Ghana | Dec'22 | 800 | 0 | 0 | 800 | 34 | H2'24 | 9.5 years | 800m total contract value, but only 40% to Sensys Gatso | |
| Sweden | Oct'22 | 850 | 425 | 425 | 0 | 35 | Q4'22 | 12 years | 2+2+2 years after first 6 years | System sales starts in Q4'23. Est. 80m per year from 2024 to 2028, then 32m. Service increase from 2m in 2023 to 40m in 2034. |
New contract for System Sales to the Middle East - SEK152m over 5 years
- System Sales of traffic cameras to a country in the Middle East, with an already significant installed base of systems from Sensys Gatso - we assume this is Saudi Arabia
- SEK16m in 2023, then SEK136m distributed between 2024 and 2027, or SEK34m per year SEK8.5m per quarter
Changes to financial estimates
Managed Services
- Raising estimates by 1-7% for 2023-2026e - partly due to more states in the USA adopting traffic enforcement solutions.
Service & Maintenance
- Small downward adjustment by -3% for 2023-2026e.
System Sales
- Increasing estimates by 22% for 2023e, but maintaining estimates for 2024-2026e.
Costs and margins
- Lowering OPEX but raising D&A and CAPEX
- Estimates on gross margin lowered for Q3 and Q4 due to installation of new projects in the USA
Estimate changes
| SEKm | 2021 | 2022 | Q1 23 | Q2 23 | Q3 23E | Q4 23E | 2023E | 2024E | 2025E | 2026E |
| System Sales | 259 | 183 | 27 | 46 | ||||||
| New | 70 | 100 | 243 | 334 | 274 | 274 | ||||
| Old | 40 | 97 | 199 | 334 | 274 | 274 | ||||
| Change | 75% | 3% | 22% | 0% | 0% | 0% | ||||
| Service & Maintenance | 113 | 123 | 36 | 32 | ||||||
| New | 33 | 34 | 135 | 151 | 163 | 163 | ||||
| Old | 34 | 35 | 138 | 155 | 167 | 167 | ||||
| Change | -3% | -3% | -3% | -3% | -3% | -3% | ||||
| Managed Services | 135 | 189 | 51 | 55 | ||||||
| New | 56 | 59 | 220 | 265 | 312 | 362 | ||||
| Old | 56 | 59 | 218 | 257 | 295 | 340 | ||||
| Change | 0% | 0% | 1% | 3% | 6% | 7% |
Estimate changes per segment
| SEKm | 2021 | 2022 | Q1 23 | Q2 23 | Q3 23E | Q4 23E | 2023E | 2024E | 2025E | 2026E |
| Total net sales | 507 | 495 | 114 | 133 | ||||||
| New | 158 | 193 | 598 | 750 | 750 | 858 | ||||
| Old | 130 | 191 | 556 | 746 | 737 | 840 | ||||
| Change | 22% | 1% | 8% | 1% | 2% | 2% | ||||
| Gross margin | 39% | 45% | 40% | 42% | ||||||
| New | 38% | 39% | 39% | 42% | 44% | 44% | ||||
| Old | 40% | 40% | 40% | 42% | 43% | 44% | ||||
| Change | -3% | -1% | -1% | 0% | 0% | 0% | ||||
| OPEX | 118 | 151 | 44 | 36 | ||||||
| New | 36 | 37 | 153 | 167 | 184 | 194 | ||||
| Old | 46 | 47 | 181 | 180 | 191 | 200 | ||||
| Change | -21% | -21% | -15% | -7% | -3% | -3% | ||||
| EBITDA | 78 | 74 | 2 | 19 | ||||||
| New | 23 | 38 | 83 | 147 | 142 | 184 | ||||
| Old | 7 | 30 | 43 | 130 | 127 | 166 | ||||
| Change | 258% | 27% | 93% | 13% | 12% | 11% | ||||
| D&A | 38 | 43 | 10 | 14 | ||||||
| New | 14 | 14 | 51 | 54 | 54 | 54 | ||||
| Old | 10 | 10 | 40 | 42 | 42 | 42 | ||||
| Change | 36% | 36% | 27% | 30% | 30% | 30% | ||||
| EBIT | 40 | 31 | -8 | 6 | ||||||
| New | 10 | 25 | 32 | 92 | 88 | 130 | ||||
| Old | -4 | 20 | 3 | 88 | 85 | 124 | ||||
| Change | -376% | 22% | 1101% | 5% | 3% | 4% | ||||
| EBIT (%) | 8% | 6% | -7% | 4% | ||||||
| New | 6% | 13% | 5% | 12% | 12% | 15% | ||||
| Old | -3% | 11% | 0% | 12% | 12% | 15% | ||||
| Change | 9% | 2% | 5% | 0% | 0% | 0% |
Financial estimates
| SEKm | 2021 | 2022 | Q1 23 | Q2 23 | Q3 23E | Q4 23E | 2023E | 2024E | 2025E | 2026E |
| Revenues | 507 | 495 | 114 | 133 | 158 | 193 | 598 | 750 | 750 | 858 |
| - System Sales | 259 | 183 | 27 | 46 | 70 | 100 | 243 | 334 | 274 | 316 |
| - Service & Maintenance | 113 | 123 | 36 | 32 | 33 | 34 | 135 | 151 | 163 | 180 |
| - Managed Services incl. Licenses | 135 | 189 | 51 | 55 | 56 | 59 | 220 | 265 | 312 | 362 |
| Gross Profit | 196 | 225 | 46 | 56 | 59 | 75 | 236 | 314 | 326 | 378 |
| EBITDA | 78 | 74 | 2 | 19 | 23 | 38 | 83 | 147 | 142 | 184 |
| EBIT | 40 | 31 | -8 | 6 | 10 | 25 | 32 | 92 | 88 | 130 |
| EPS (SEK) | 0.04 | 0.02 | -0.014 | 0.322 | 0.740 | 1.763 | 1.69 | 6.46 | 6.38 | 9.30 |
| Growth (%) | 11% | -2% | 0% | 7% | 66% | 20% | 21% | 65% | 0% | 14% |
| Gross margin | 39% | 45% | 40% | 42% | 38% | 39% | 39% | 42% | 44% | 44% |
| EBITDA margin (%) | 15% | 15% | 2% | 14% | 15% | 20% | 14% | 20% | 19% | 21% |
| EBIT margin (%) | 8% | 6% | -7% | 4% | 6% | 13% | 5% | 12% | 12% | 15% |
| Net income margin (%) | 7% | 4% | -12% | 3% | 5% | 11% | 3% | 10% | 9% | 12% |
Fair value range
| Assumptions, fair value range | |||
| Bear Case | Base case | Bull case | |
| Value per share, SEK | 65.0 | 124.6 | 185.6 |
| CAGR 2023-2027 per segment | |||
| Managed Services | 13% | 17% | 19% |
| Service & Maintenance | 6% | 10% | 12% |
| System Sales | 8% | 12% | 14% |
| Total | 10% | 14% | 16% |
| Total sales 2027 | 790 | 945 | 1,031 |
| Profitabilty assumptions | |||
| EBIT margin 2027 | 12% | 18% | 23% |
Quality Rating
People: 4
The Gatso acquisition in summer 2015 was a logical acquisition of stability in the form of a high proportion of much-needed recurring revenue, but the order intake has not been convincing until recently. Sensys Gatso’s CEO has worked in entirely different industries, but parts of the management team have extensive experience from working a long time for Gatso, although the old Sensys management team has left. An incentive scheme is reserved for global management and selected employees. In conjunction with the acquisition, Sensys Gatso gained an industrial principal shareholder. The former Gatso management holds ~17% of the shares and has committed operationally to the management. Shareholdings among the rest of the management are still too low, in our opinion. All members of the board own shares, but the size of the board members' holdings generally are too small.
Business: 4
More than half of Sensys Gatso’s revenues are recurring in the shape of Managed Services and service and maintenance sales. These revenues are both sticky and of a high-margin character. Competition remains intense even after the Gatso acquisition and the European market may need consolidation. While the company has an interesting position as a market leader on the system side, we think Managed Services comprises the true jewel of the company. The business is resilient against economic ups and downs and may actually benefit in tougher times when countries with budget deficits look for new sources of income. It should however be noted that the market conditions are largely affected by the volatile political climate.
Financials: 3
After a long history with weak profitability, Sensys Gatso turned profitable on a 12months basis in 2020 and has since only improved margins. The company also has a healthy balance sheet with a net cash position. The dependence on individual large deals has also been reduced as the majority of the company’s revenues are now recurring. For an even higher rating, a longer streak of profitability is required with further enhanced margins.
Financials
| Income statement | |||||
| SEKm | 2020 | 2021 | 2022 | 2023e | 2024e |
| Revenues | 454.9 | 506.8 | 494.7 | 597.9 | 750.1 |
| Cost of Revenue | 293.1 | 310.5 | 269.6 | 361.8 | 436.5 |
| Operating Expenses | 102.4 | 118.3 | 151.4 | 153.5 | 166.7 |
| EBITDA | 59.4 | 77.9 | 73.7 | 82.7 | 146.9 |
| Depreciation | 0.00 | 0.00 | 0.00 | 0.00 | 0.00 |
| Amortizations | 48.6 | 37.6 | 41.4 | 40.0 | 40.0 |
| EBIT | 10.8 | 40.3 | 31.0 | 31.9 | 92.5 |
| Shares in Associates | 1.3 | 1.3 | 0.00 | 0.00 | 0.00 |
| Interest Expenses | 9.8 | 4.8 | 10.1 | 3.8 | 0.00 |
| Net Financial Items | -28.0 | 3.7 | 2.3 | -3.8 | 0.00 |
| EBT | -17.2 | 43.9 | 33.2 | 28.0 | 92.5 |
| Income Tax Expenses | -1.5 | 7.8 | 13.0 | 8.8 | 19.1 |
| Net Income | -15.7 | 36.2 | 20.2 | 19.5 | 74.4 |
| Balance sheet | |||||
| Assets | |||||
| Non-current assets | |||||
| SEKm | 2020 | 2021 | 2022 | 2023e | 2024e |
| Property, Plant and Equipment (Net) | 59.3 | 59.3 | 70.6 | 75.6 | 79.6 |
| Goodwill | 242.1 | 242.1 | 276.7 | 276.7 | 276.7 |
| Intangible Assets | 36.2 | -1.4 | 0.00 | 30.0 | 34.0 |
| Right-of-Use Assets | 9.9 | 9.9 | 0.00 | 0.00 | 0.00 |
| Other Non-Current Assets | 67.4 | 0.00 | 143.6 | 0.00 | 0.00 |
| Total Non-Current Assets | 416.2 | 311.2 | 490.9 | 382.4 | 390.4 |
| Current assets | |||||
| SEKm | 2020 | 2021 | 2022 | 2023e | 2024e |
| Inventories | 127.3 | 96.8 | 85.2 | 119.6 | 150.0 |
| Accounts Receivable | 69.4 | 141.3 | 67.4 | 107.6 | 127.5 |
| Other Current Assets | 45.8 | 50.6 | 85.0 | 47.8 | 60.0 |
| Cash Equivalents | 108.5 | 72.5 | 99.7 | -18.5 | 0.74 |
| Total Current Assets | 351.0 | 361.1 | 337.3 | 256.5 | 338.3 |
| Total Assets | 767.2 | 672.3 | 828.3 | 638.9 | 728.7 |
| Equity and Liabilities | |||||
| Equity | |||||
| SEKm | 2020 | 2021 | 2022 | 2023e | 2024e |
| Non Controlling Interest | -2.0 | -2.0 | 0.00 | 0.00 | 0.00 |
| Shareholder's Equity | 516.6 | 552.7 | 626.1 | 635.4 | 700.1 |
| Non-current liabilities | |||||
| SEKm | 2020 | 2021 | 2022 | 2023e | 2024e |
| Long Term Debt | 8.8 | 8.8 | 22.0 | 22.0 | 22.0 |
| Long Term Lease Liabilities | 28.2 | 28.2 | 22.3 | 22.3 | 22.3 |
| Other Long Term Liabilities | 28.5 | 28.5 | 30.8 | 30.8 | 30.8 |
| Total Non-Current Liabilities | 65.5 | 65.5 | 75.0 | 75.0 | 75.0 |
| Current liabilities | |||||
| SEKm | 2020 | 2021 | 2022 | 2023e | 2024e |
| Short Term Debt | 0.00 | 0.00 | 8.8 | 8.8 | 8.8 |
| Short Term Lease Liabilities | 10.0 | 10.0 | 10.5 | 10.5 | 10.5 |
| Accounts Payable | 62.4 | 37.1 | 20.4 | 41.9 | 52.5 |
| Other Current Liabilities | 114.7 | 50.7 | 87.5 | 0.00 | 0.00 |
| Total Current Liabilities | 187.2 | 97.8 | 127.2 | 61.2 | 71.8 |
| Total Liabilities and Equity | 767.2 | 714.0 | 828.3 | 771.6 | 847.0 |
| Cash flow | |||||
| SEKm | 2020 | 2021 | 2022 | 2023e | 2024e |
| Operating Cash Flow | 15.5 | -2.7 | 184.7 | -33.1 | 77.0 |
| Investing Cash Flow | -33.0 | -42.0 | -35.6 | -75.0 | -48.0 |
| Financing Cash Flow | 73.0 | 0.00 | -18.1 | -10.1 | -9.7 |
Rating definitions
The team
Disclosures and disclaimers